
Fluorescent Immersion Range Scanning
Matthias B. Hullin1
Martin Fuchs1
Ivo Ihrke2,1
Hans-Peter Seidel1
Hendrik P. A. Lensch1
1MPI Informatik 2University of British Columbia
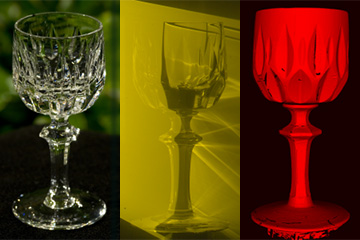
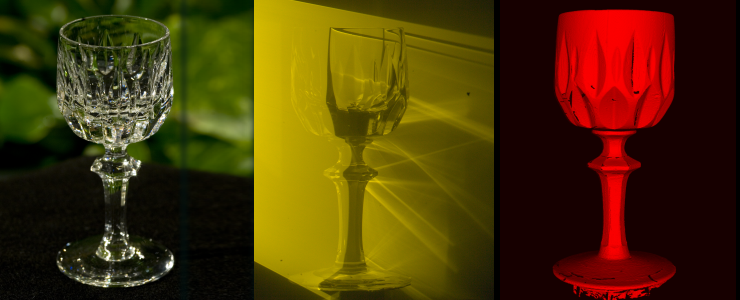 Example of surface scanning. From left to right: photo of real object, example shot in fluorescent immersion, reconstructed 3D geometry.
SIGGRAPH 2008 Paper
 Read Full Paper (PDF, 300dpi, 9 MB)
Read Full Paper (PDF, full-res, 47 MB)
Read Full Paper (PDF, 300dpi, 9 MB)
Read Full Paper (PDF, full-res, 47 MB)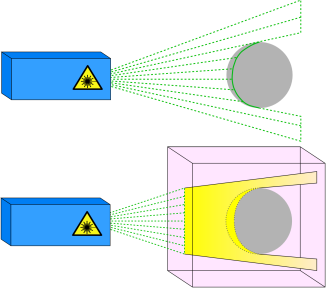
Principle of triangulation range scanning.
Top: traditional setup. Bottom: ours.
About the Method
The quality of a 3D range scan should be independent of the surface properties of the object. Most active range scanning techniques, however, assume a diffuse reflector to allow for a robust detection of incident light patterns. In our approach we embed the object in a fluorescent liquid. By analyzing the light rays that are visible due to fluorescence rather than analyzing their reflections off the surface we can detect the intersection points between the projected laser sheet and the object surface for a wide range of materials with different reflectance properties.
Example stack of input images.
Use slider to move the laser sheet.
First Surface Scanning
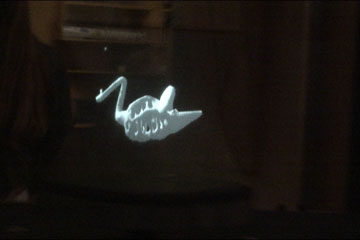
The video to the right shows a typical set of input images. A glass object is placed in a fluorescent volume and illuminated by a light sheet from the left. As the light sheet scans over the object, we can clearly see where it hits the surface: it is where the brightness drops. Behind the object, we can see volume caustics due to refraction in the glass.
We analyze this stack of images by computing the 3D gradient along the two camera coordinates and the laser coordinate. Space-time analysis for 3D scanning was first proposed by Curless and Levoy in their ICCV'95 paper "Better optical triangulation through spacetime analysis".
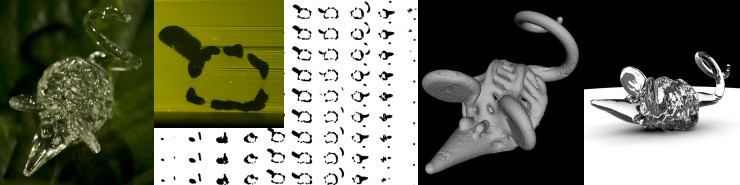 Example of volume scanning. From left to right: photo of real object, example volume slice and stack of volume slices, surface mesh, rendering in virtual environment.
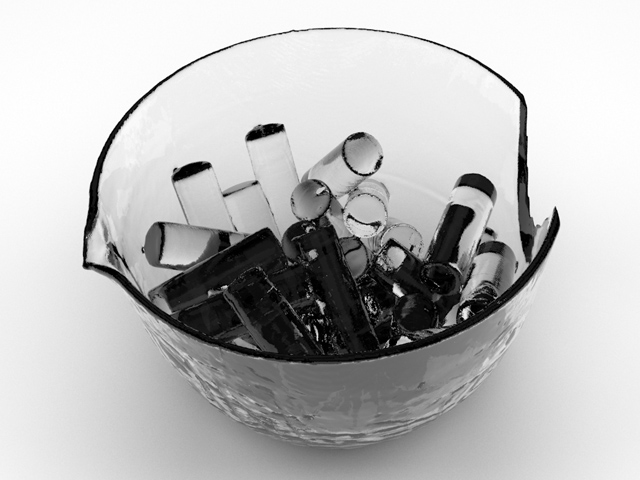
Bowl filled with glass cylinders.
Slicing the glass cylinders.
Use slider to move the laser sheet.
Direct Volume Slicing
If a transparent object has a constant refractive index, such as this bowl of quartz glass filled with glass cylinders, we can even directly depict a slice through the volume in just one image. This can be accomplished by matching the refractive index of the embedding liquid to the one of the object. Once this is done, the object geometry can be directly sampled without the need for computational reconstruction. We obtain a high-resolution 3D volume simply by sweeping a laser plane through the object.
Result Images
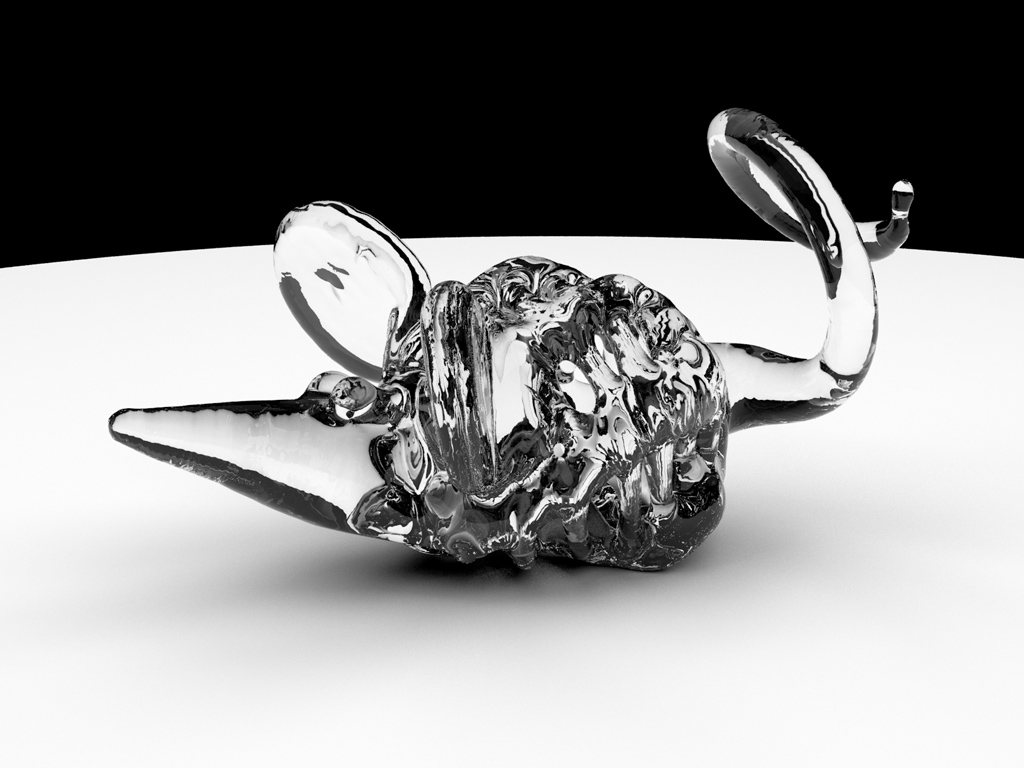
The following images were rendered from the cylinders and mouse datasets using pbrt.
Mesh data
Download the full mesh of our mouse as reconstructed by our volume scanning technique. You may use the model in your work, and if you do, please make sure to acknowledge the source of the data.
Please note that part of the cylinders mesh appears "chipped off" since the object was not completely inside the calibrated acquisition volume. Also, the cylinders model has a hole underneath.
Glass mouse (141k vertices, 283k triangles)  OBJ (9 MB)
STL (14 MB)
OBJ (9 MB)
STL (14 MB)
Glass cylinders in bowl (830k vertices, 1.6M triangles)
OBJ (66 MB)
STL (81MB)
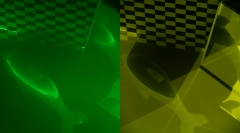
Multiple vs. single scattering.
More information
Visit the Virtual Scattering Lab and learn how to get rid of multiple scattering.
Videos
Paper Video
This video explains the method of Fluorescent Immersion Range Scanning and shows some of our results.
 Download paper video
(05:32, 22 MB, Quicktime H.264)
Glass Mouse
This is a video of the mouse object as reconstructed by our volume slicing method. Rendering was performed by Miguel Granados using the standard glass shader in pbrt. (Mesh was smoothed in MeshLab before rendering. No global illumination, we just used an area light source for smooth shadows.)
Download high quality video(00:12, 1024x768, 7MB, msmpeg4v1)
Just for the fun of it, we took a low-poly version of the mouse mesh and put it on the amazing Interactive 360º Light Field Display at the Graphics Lab of USC/ICT. In the first part of the video, the camera moves around the display, showing the model in its full 3D glory. Later, Andrew Jones uses the Wii Control to interactively rotate the model.
Download "Mouse on ICT 3D Display"(00:52, 720x440, 13MB, msmpeg4v1)
Bibliography
Matthias B. Hullin, Martin Fuchs, Ivo Ihrke, Hans-Peter Seidel, Hendrik P. A. Lensch, "Fluorescent Immersion Range Scanning" , ACM Trans. on Graphics (Proceedings of ACM SIGGRAPH 2008), Volume 27, Issue 3 (August 2008).
@article{Hullin:2008:FIRS,
    title = "Fluorescent Immersion Range Scanning",
    author = "Matthias B. Hullin and Martin Fuchs and Ivo Ihrke and Hans-Peter Seidel and
        Hendrik P. A. Lensch",
    journal = "ACM Transactions on Graphics",
    volume = 27,
    number = 3,
    month = aug,
    year = 2008,
    pages = "87:1--87:10",
  }