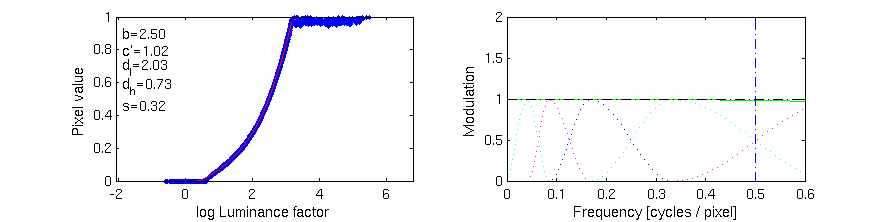
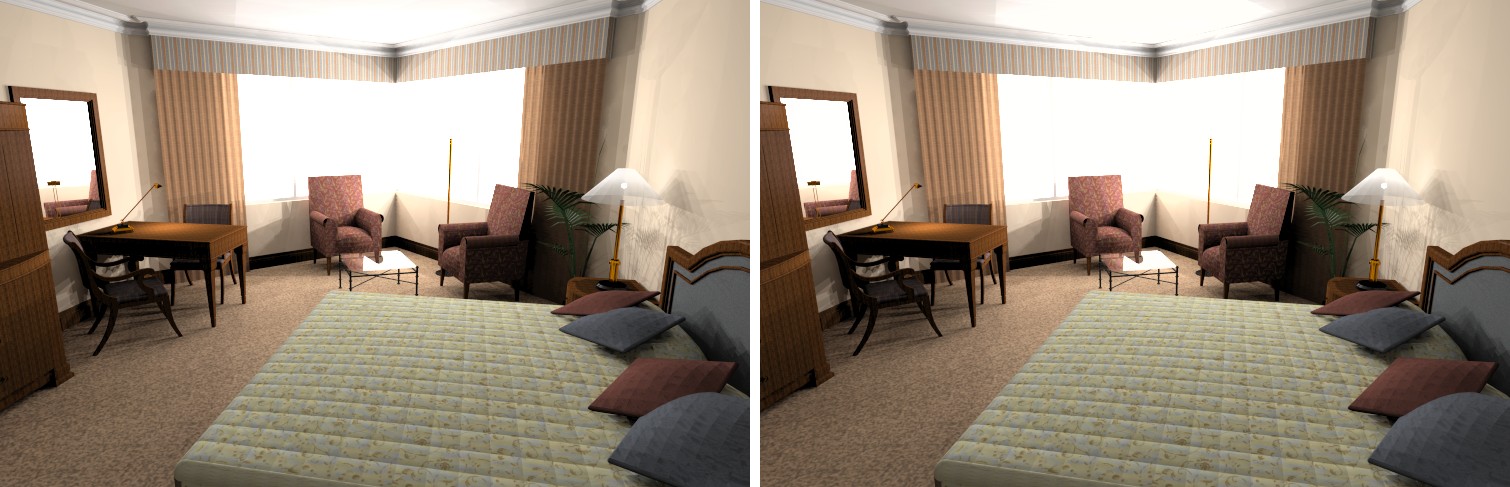
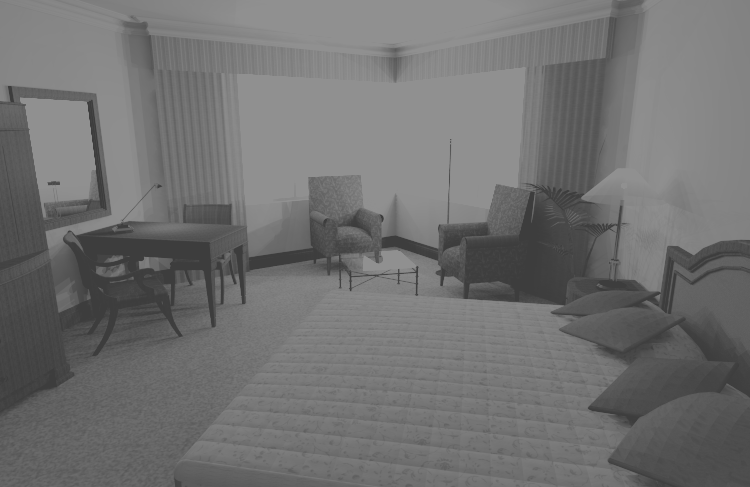
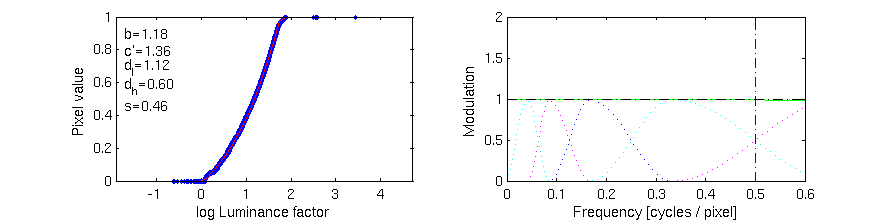
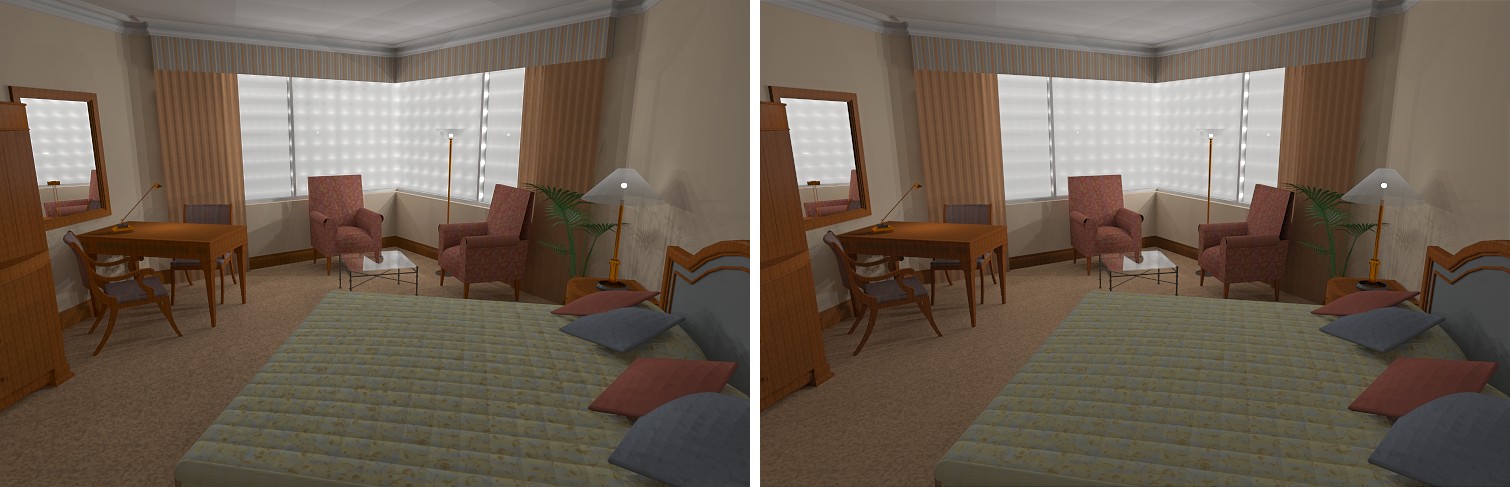
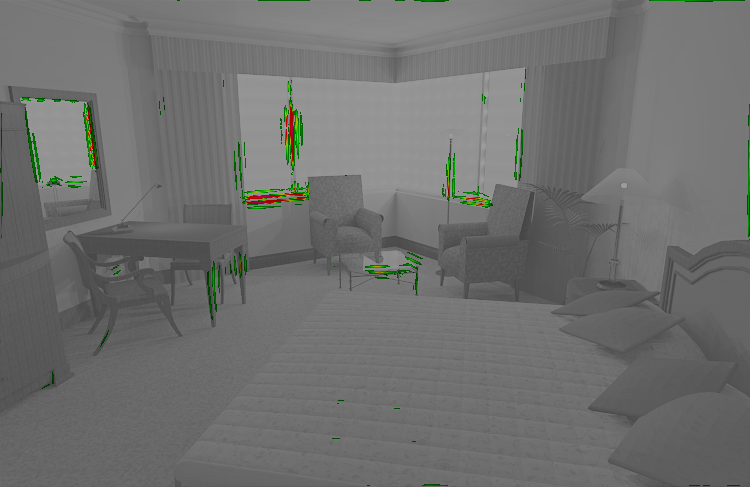
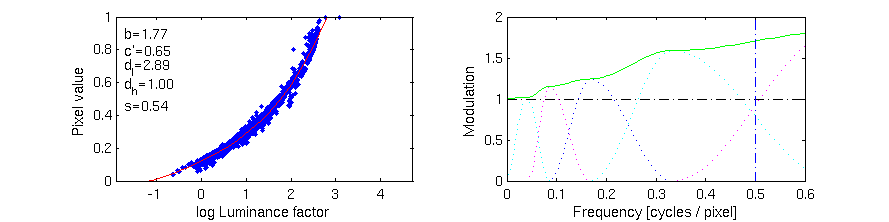
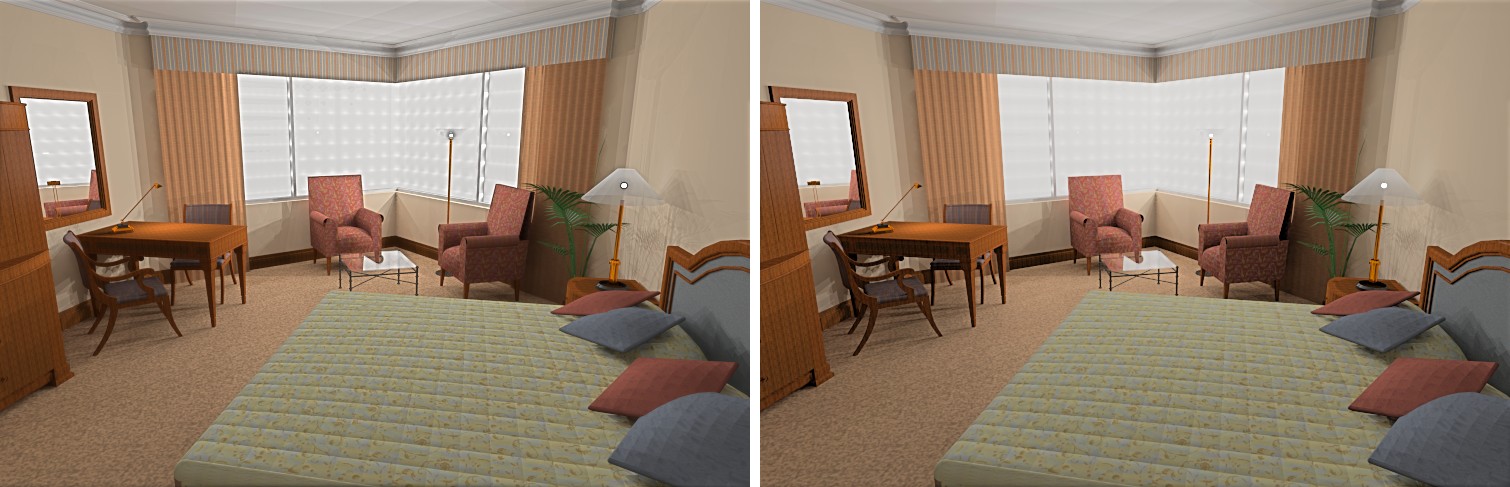
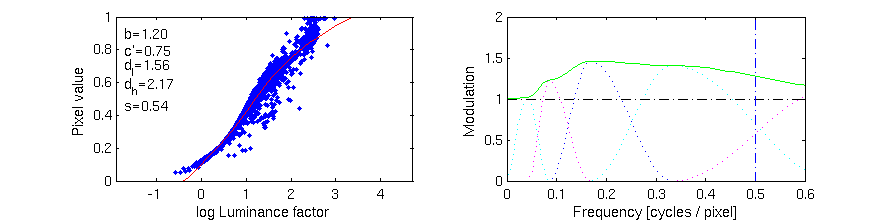
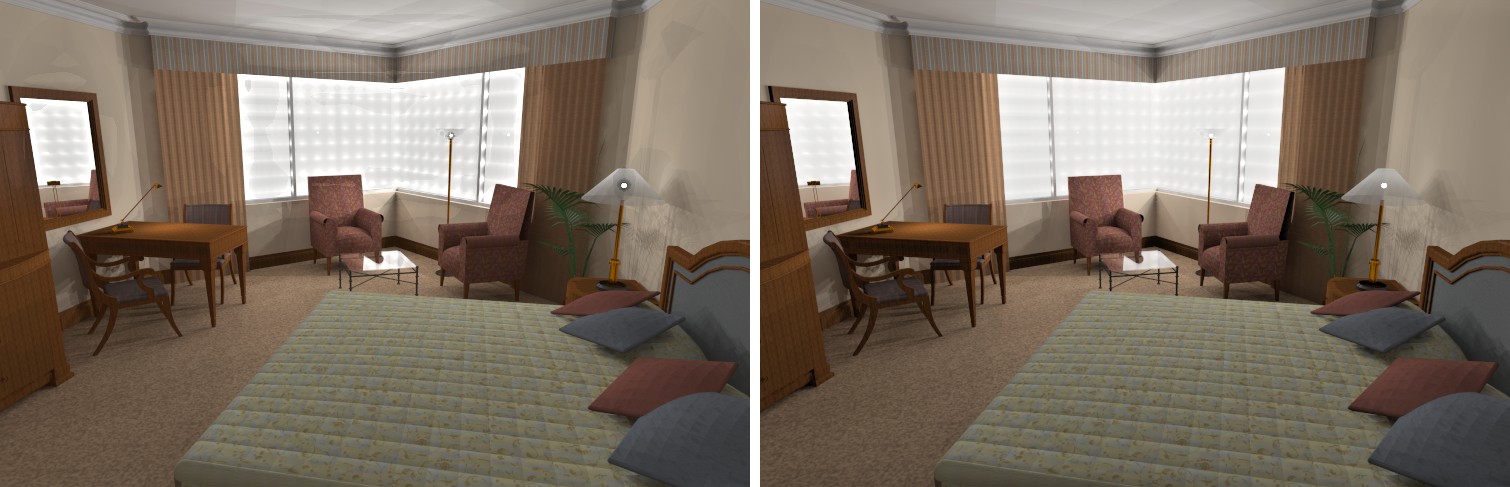
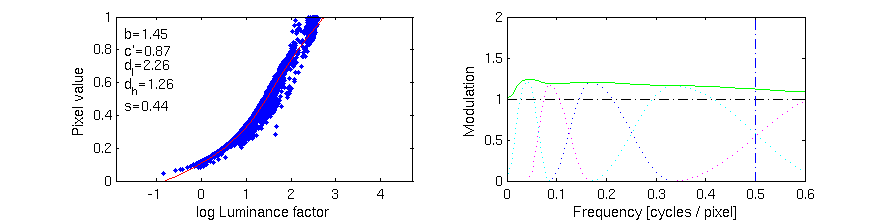
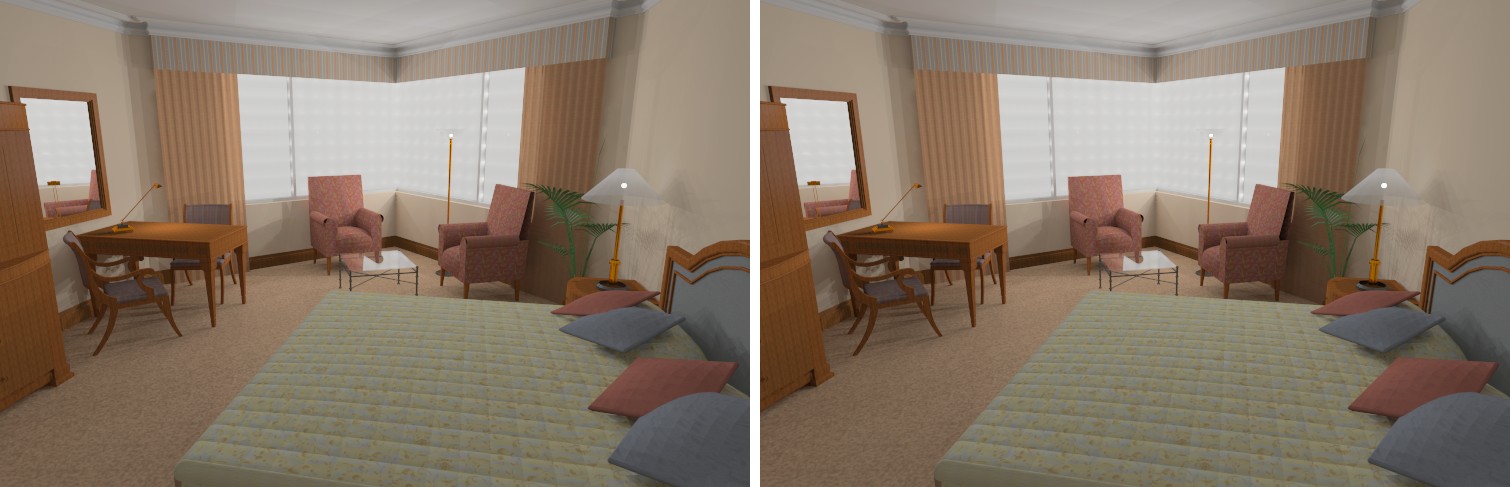
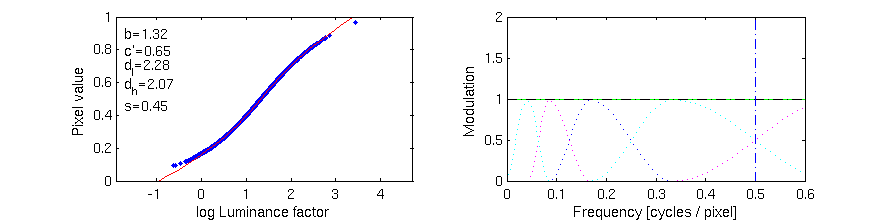
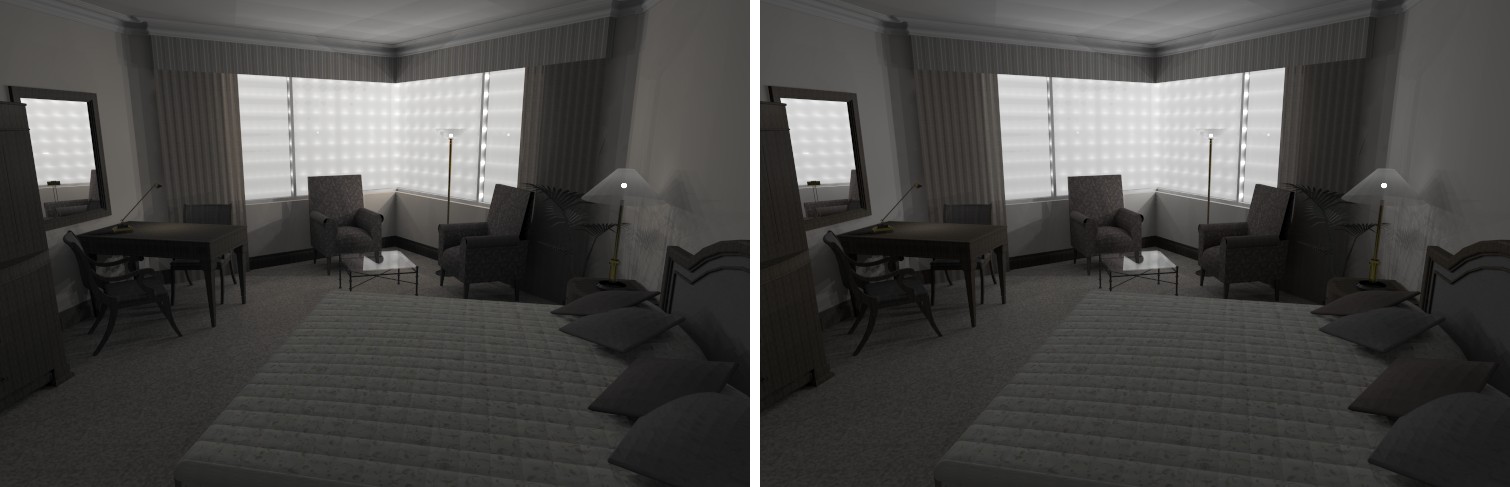
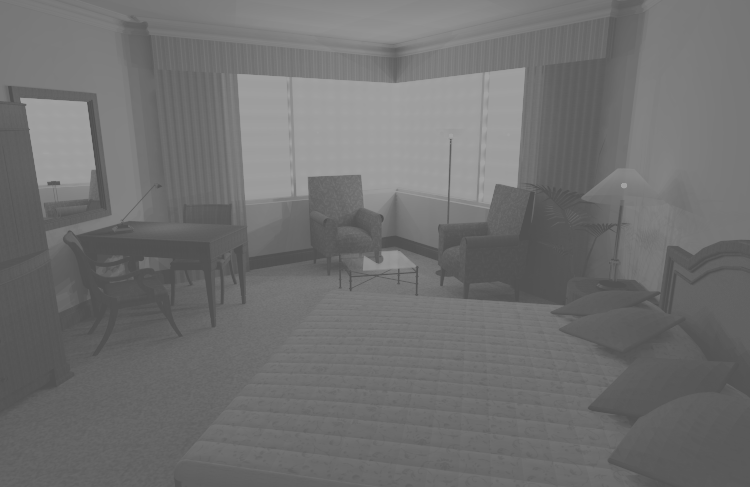
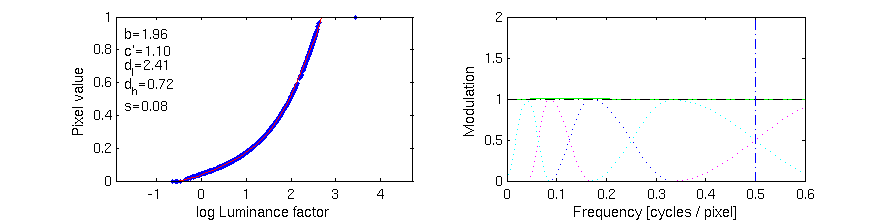
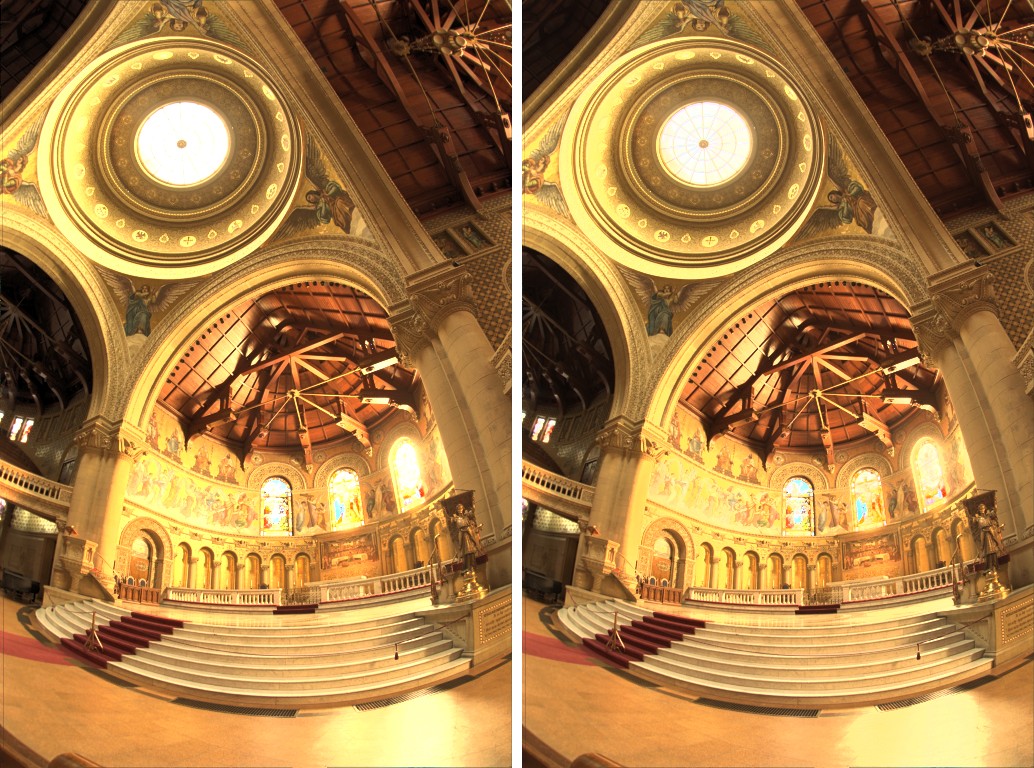
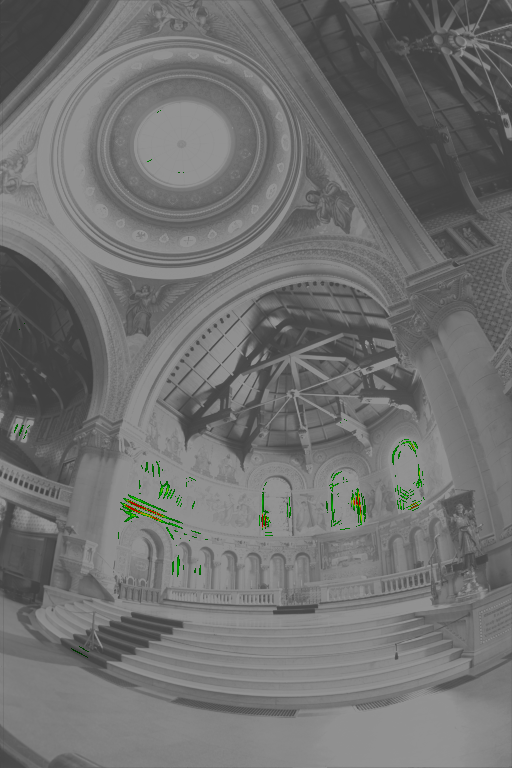
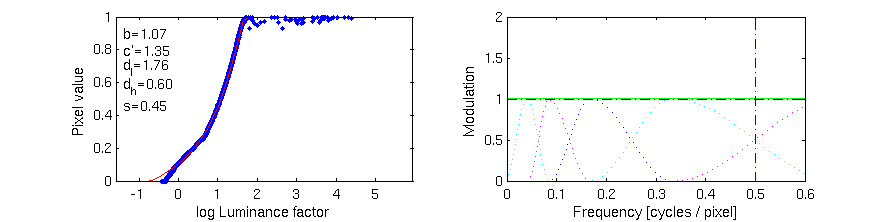
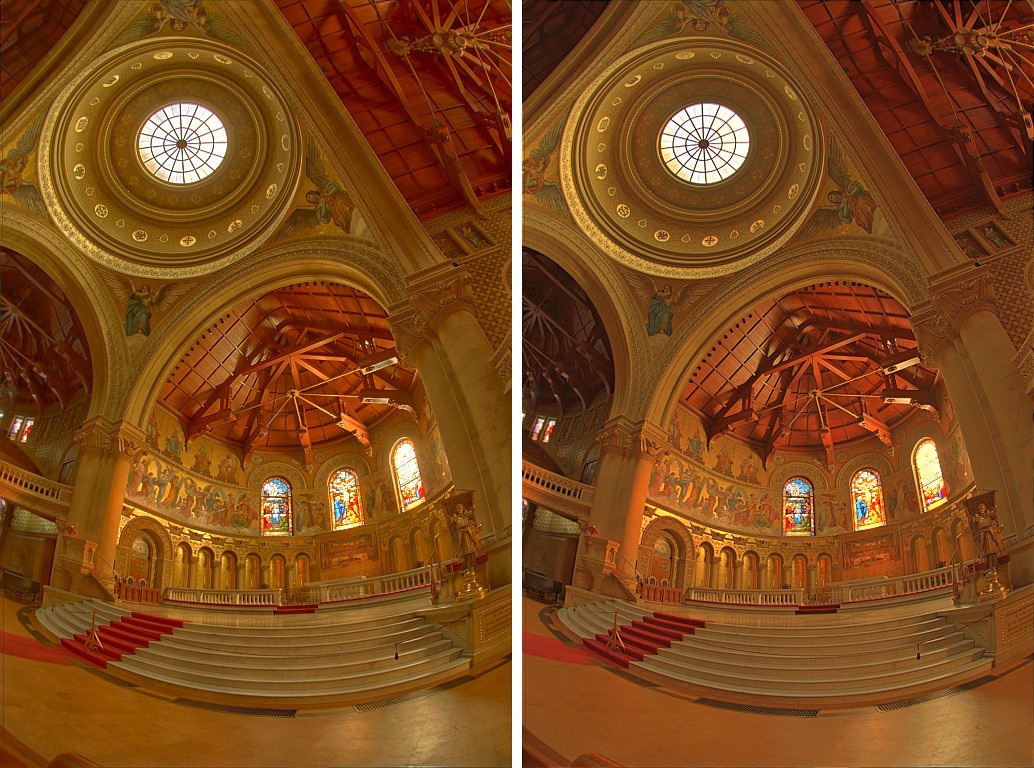
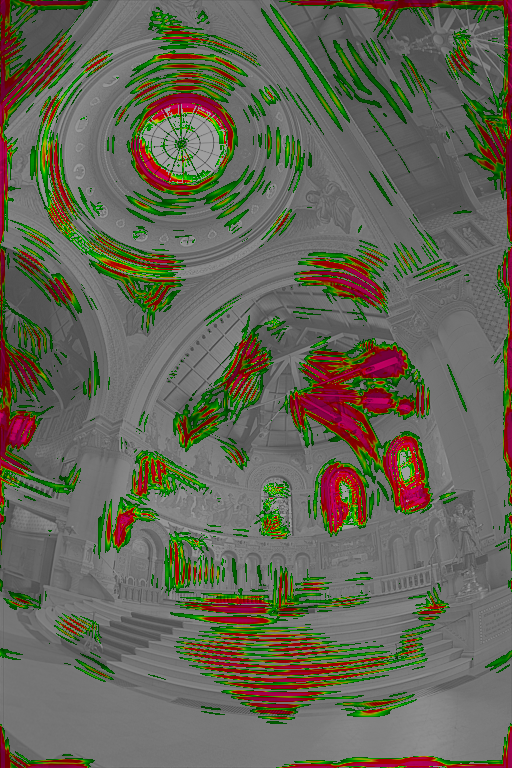
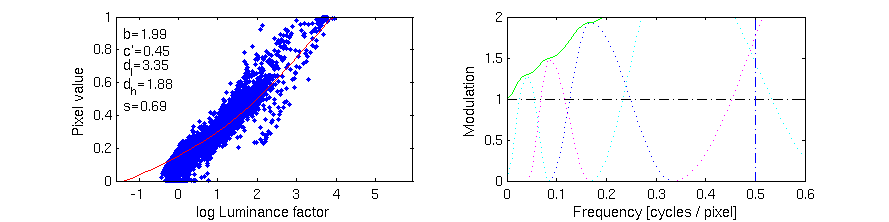
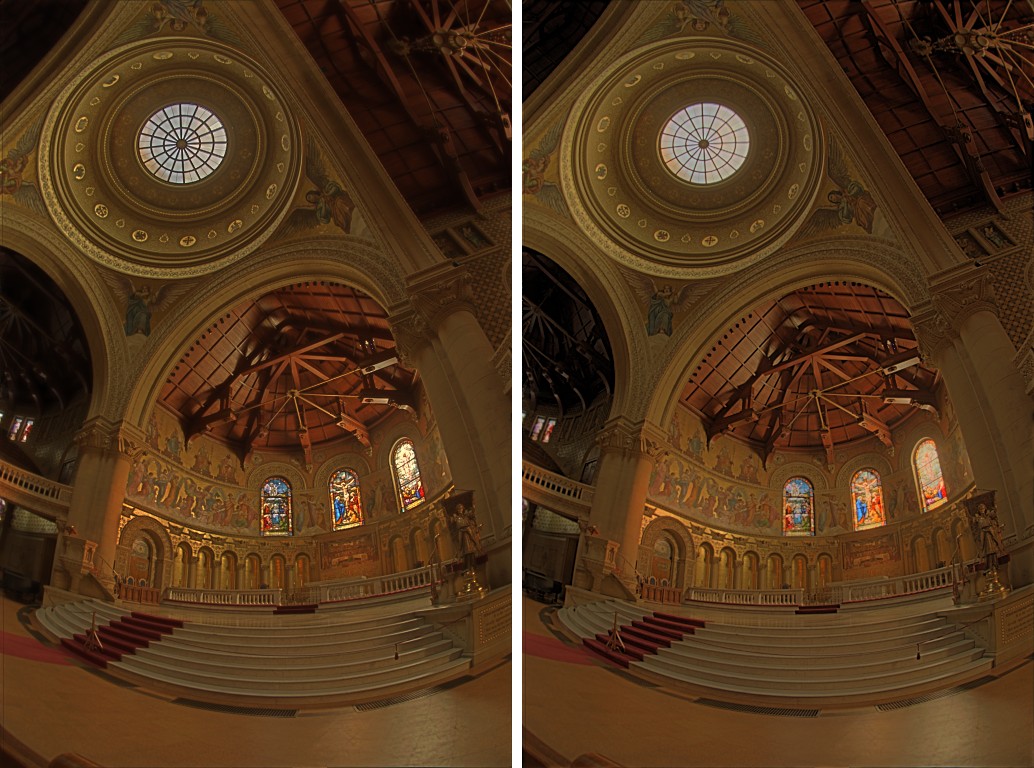
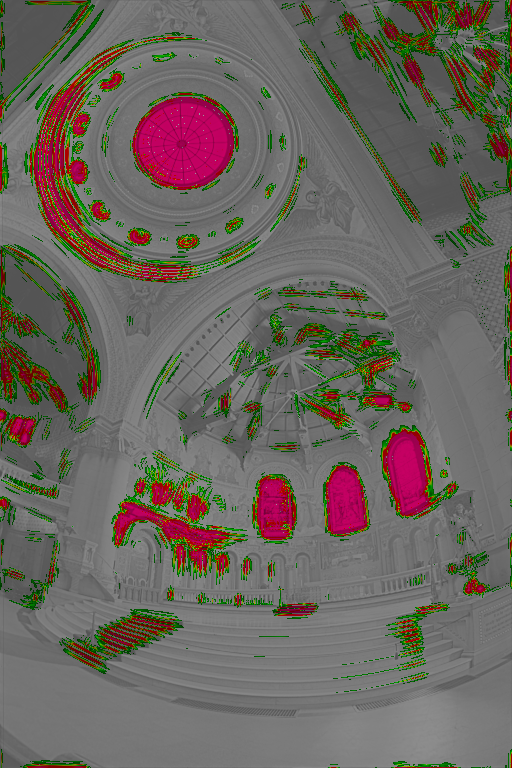
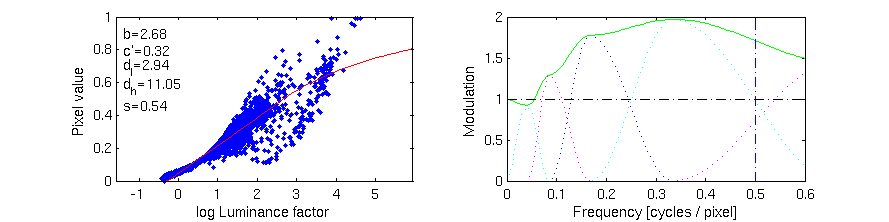
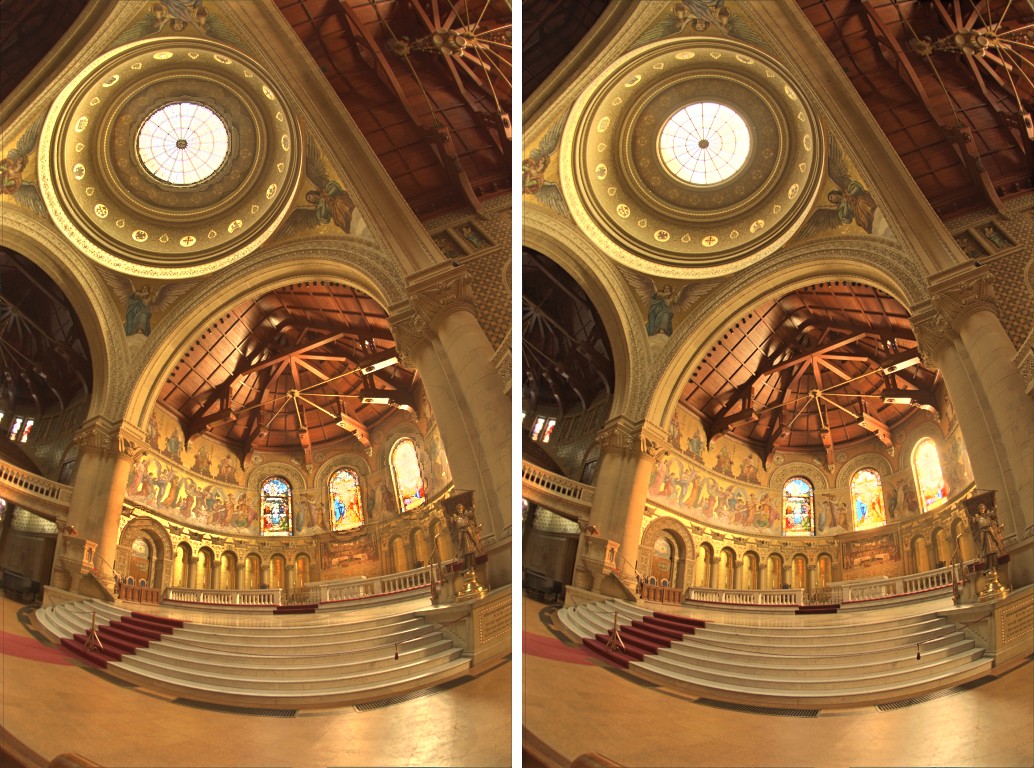
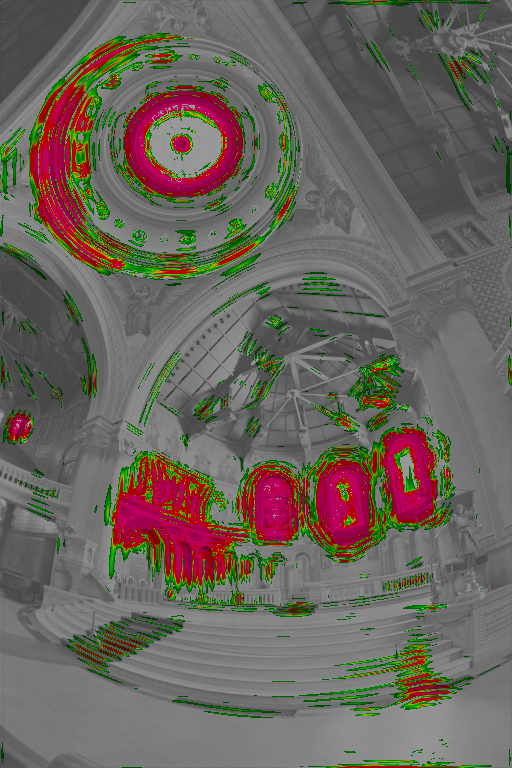
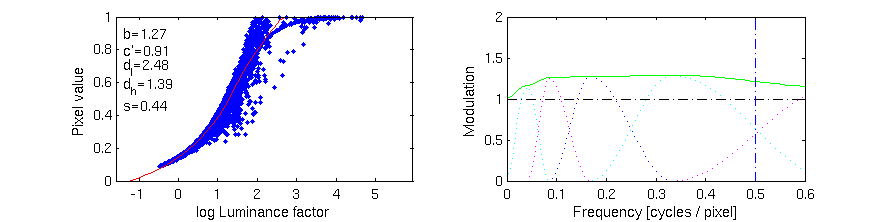
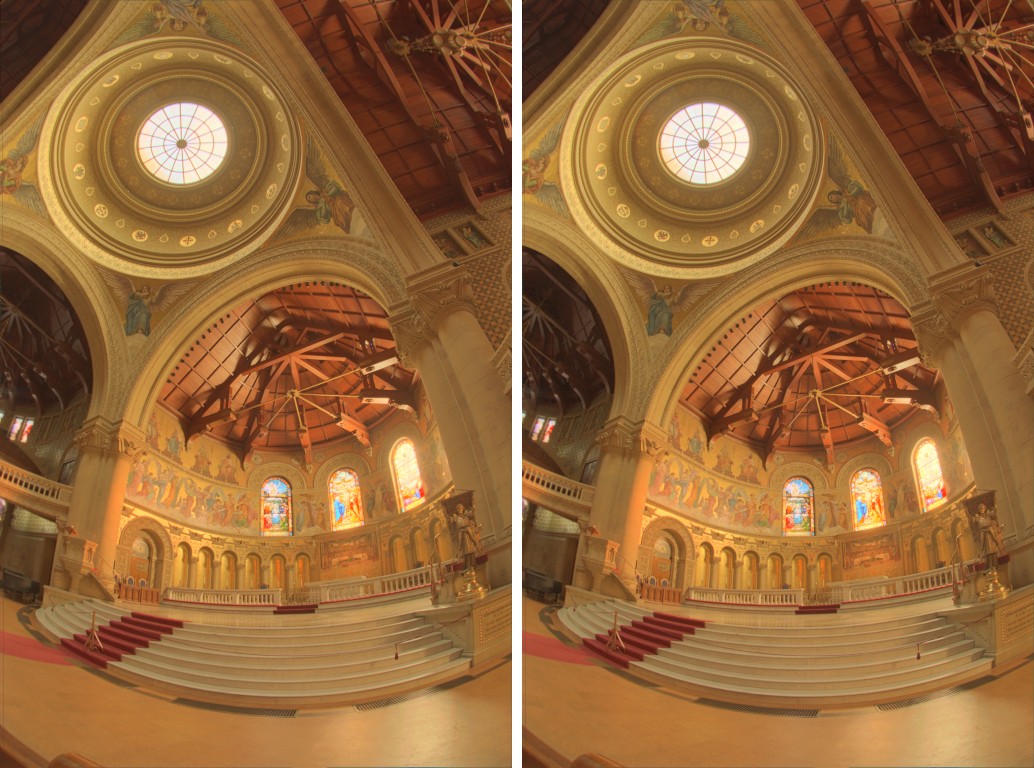
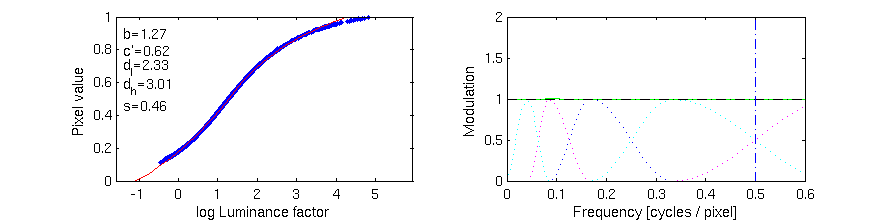
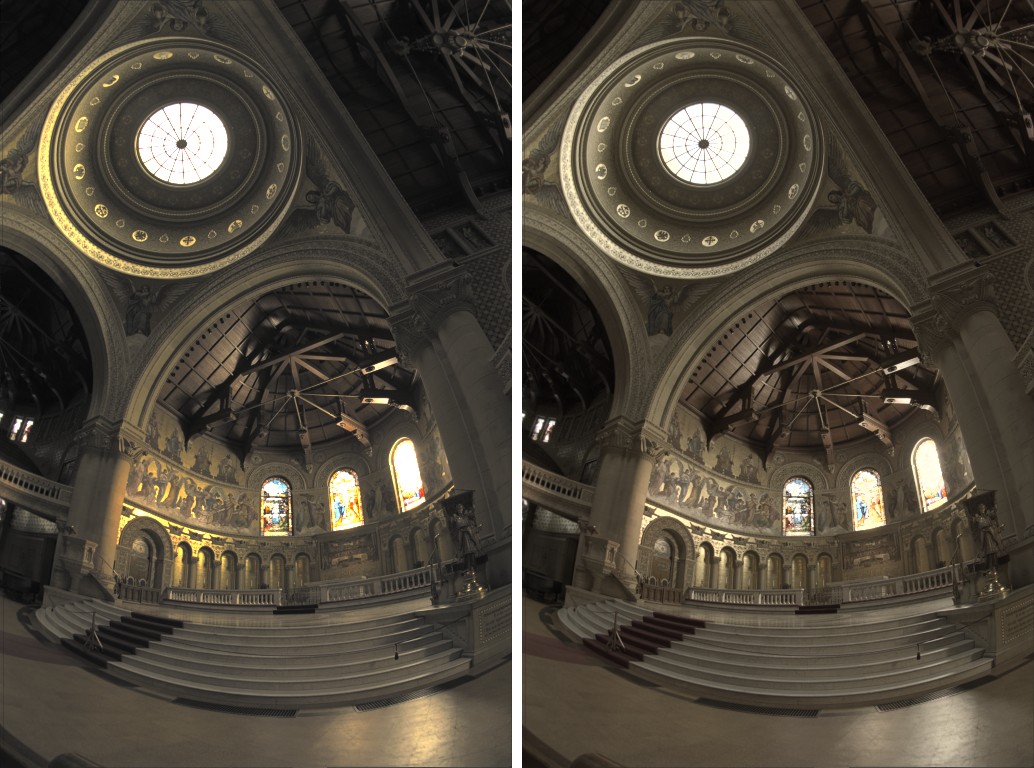
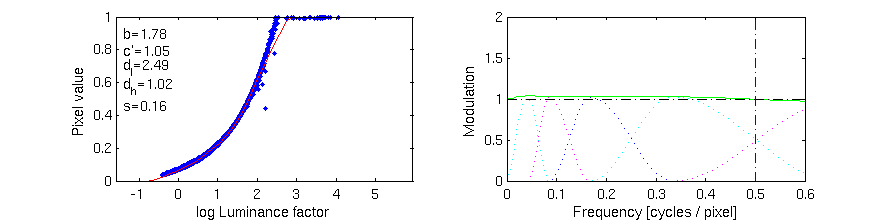
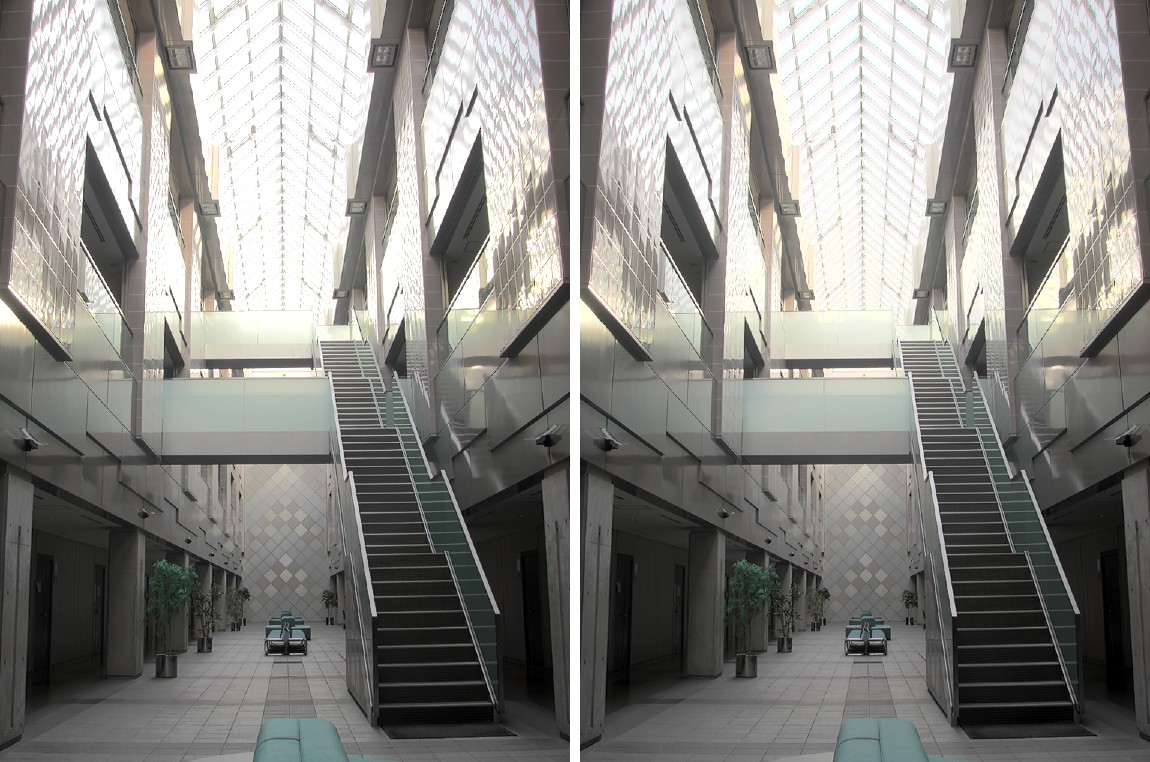
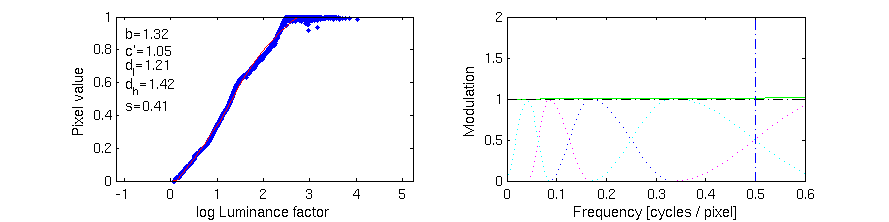
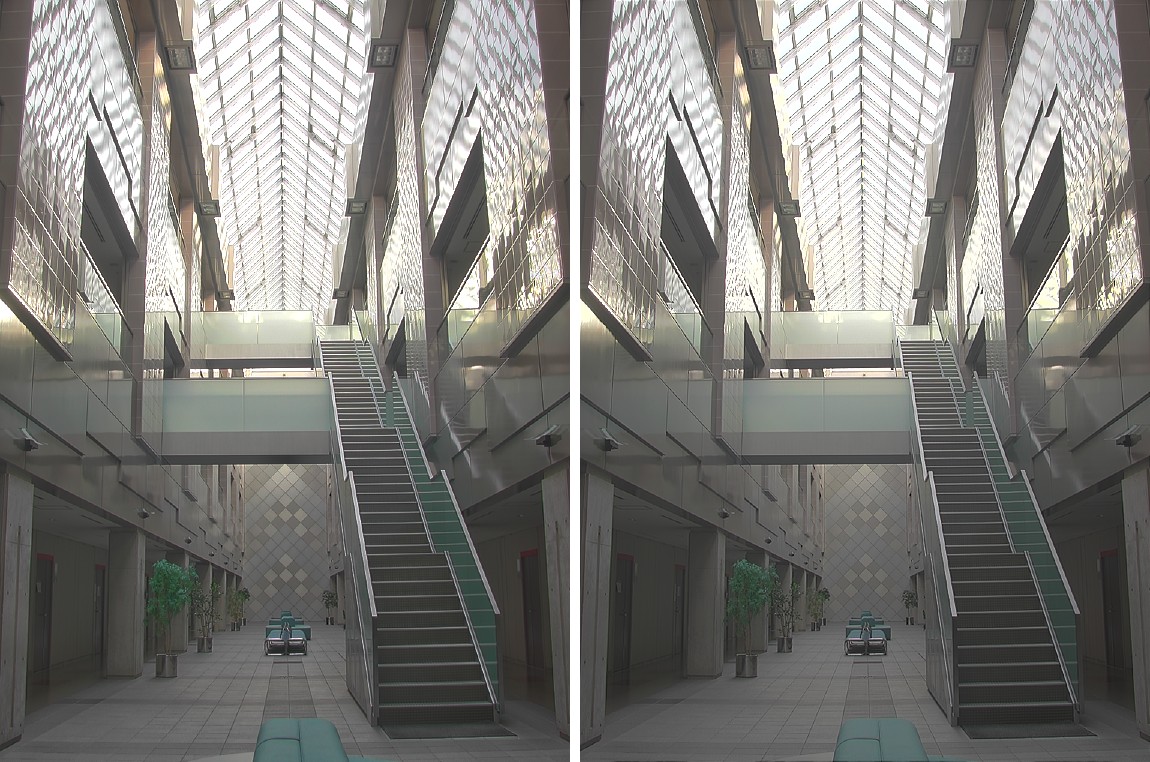
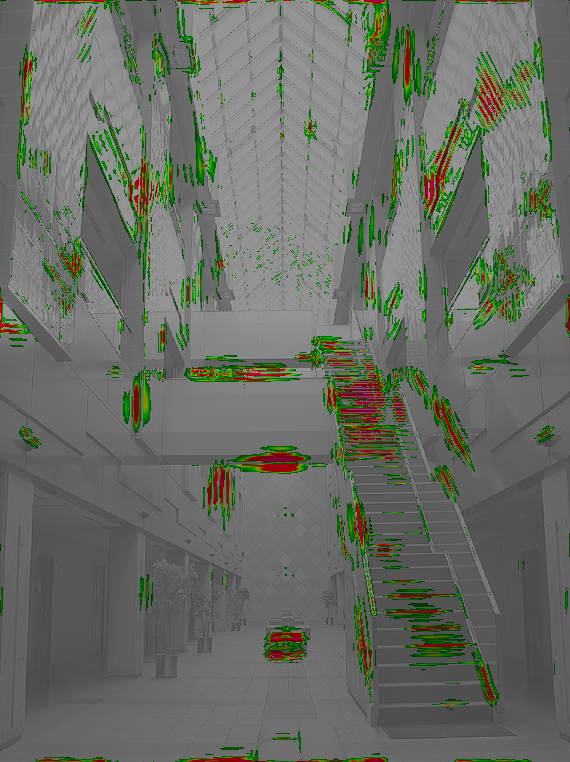
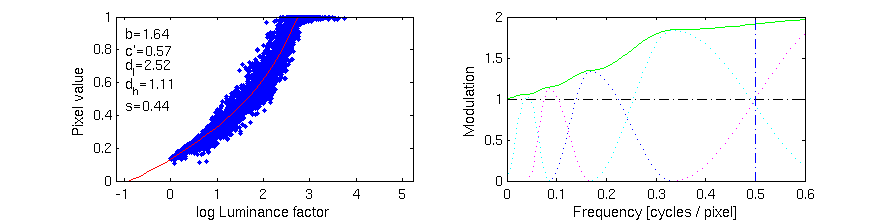
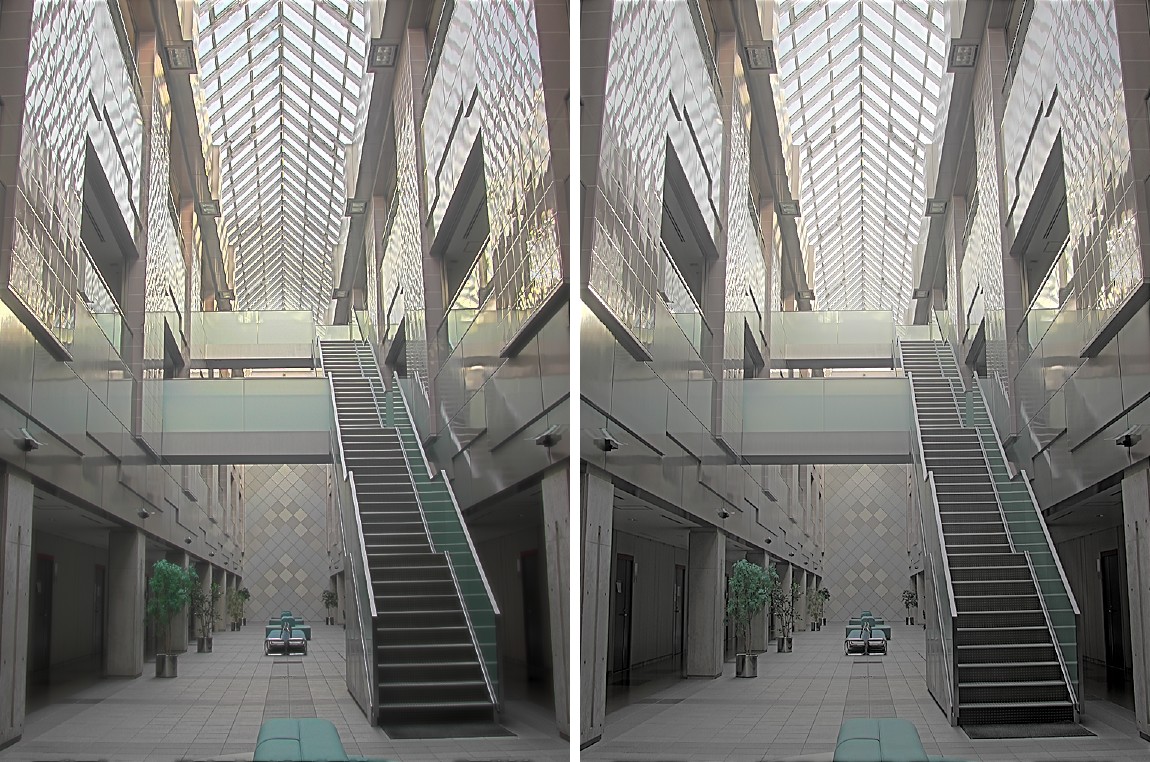
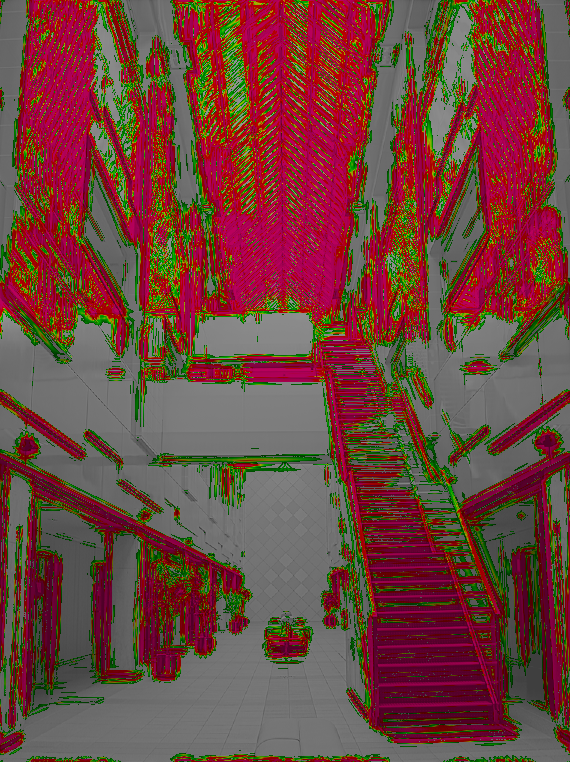
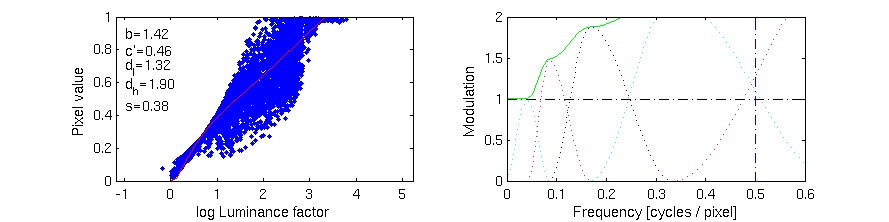
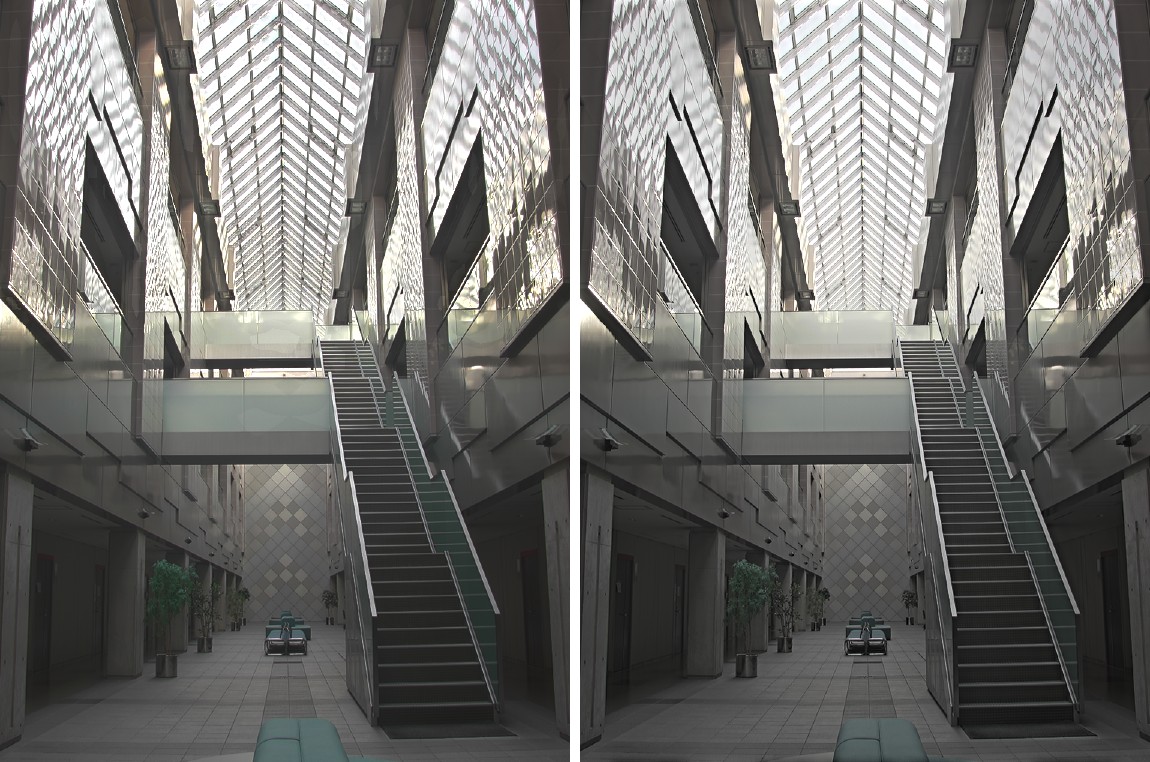
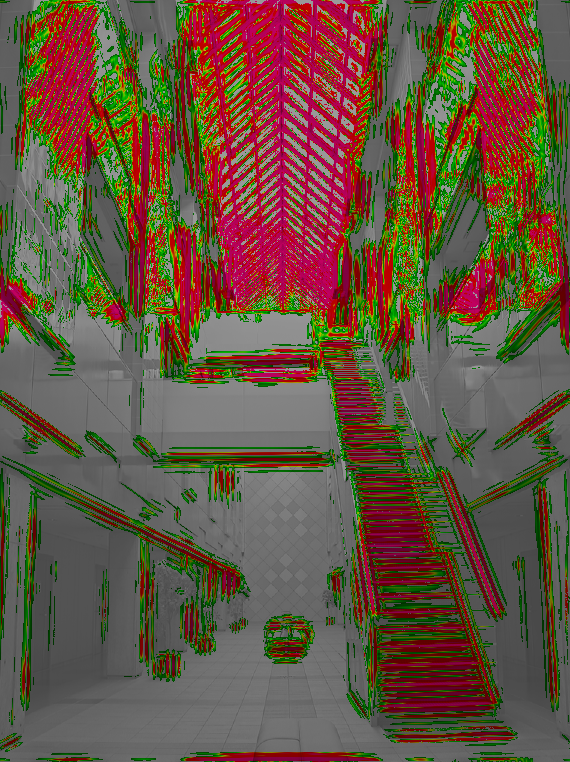
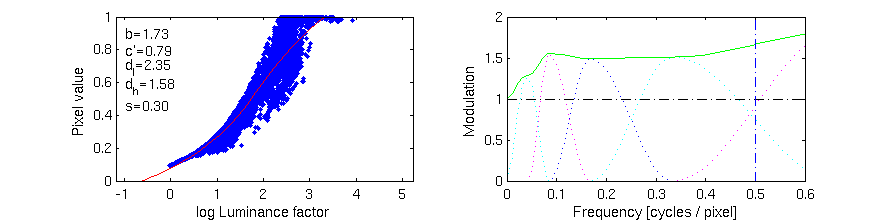
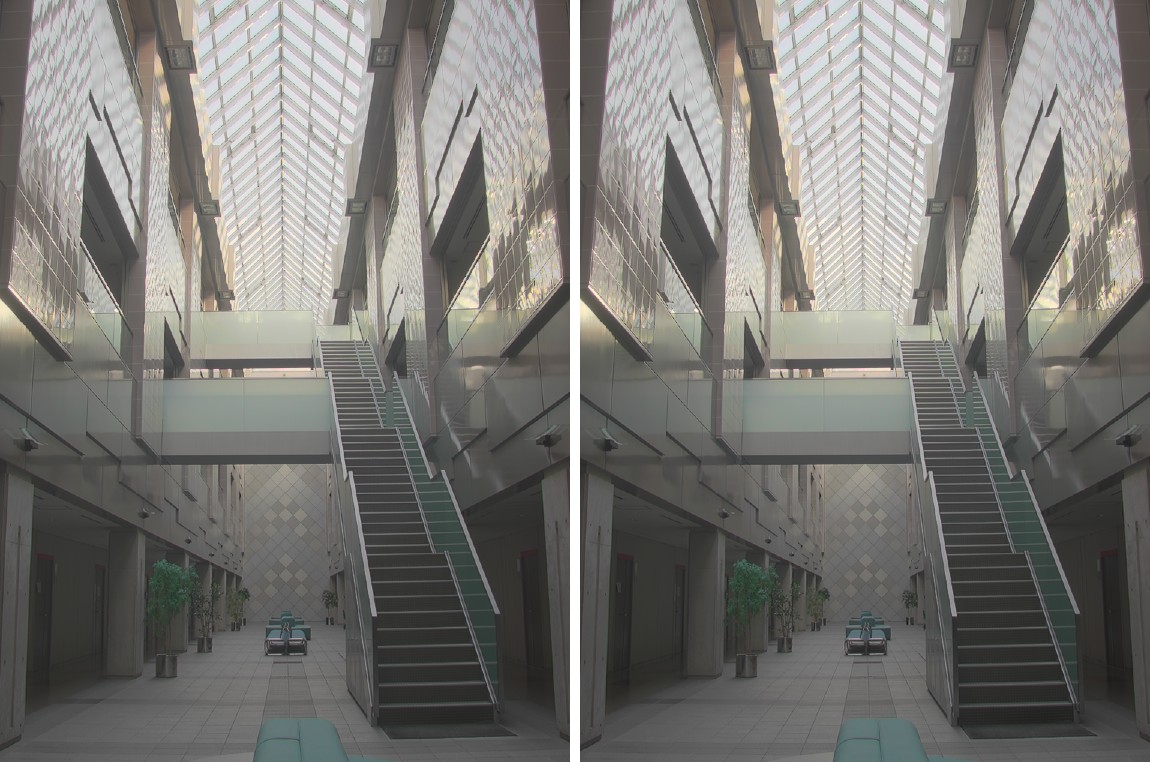
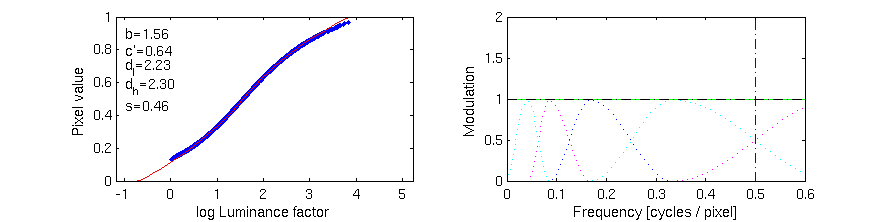
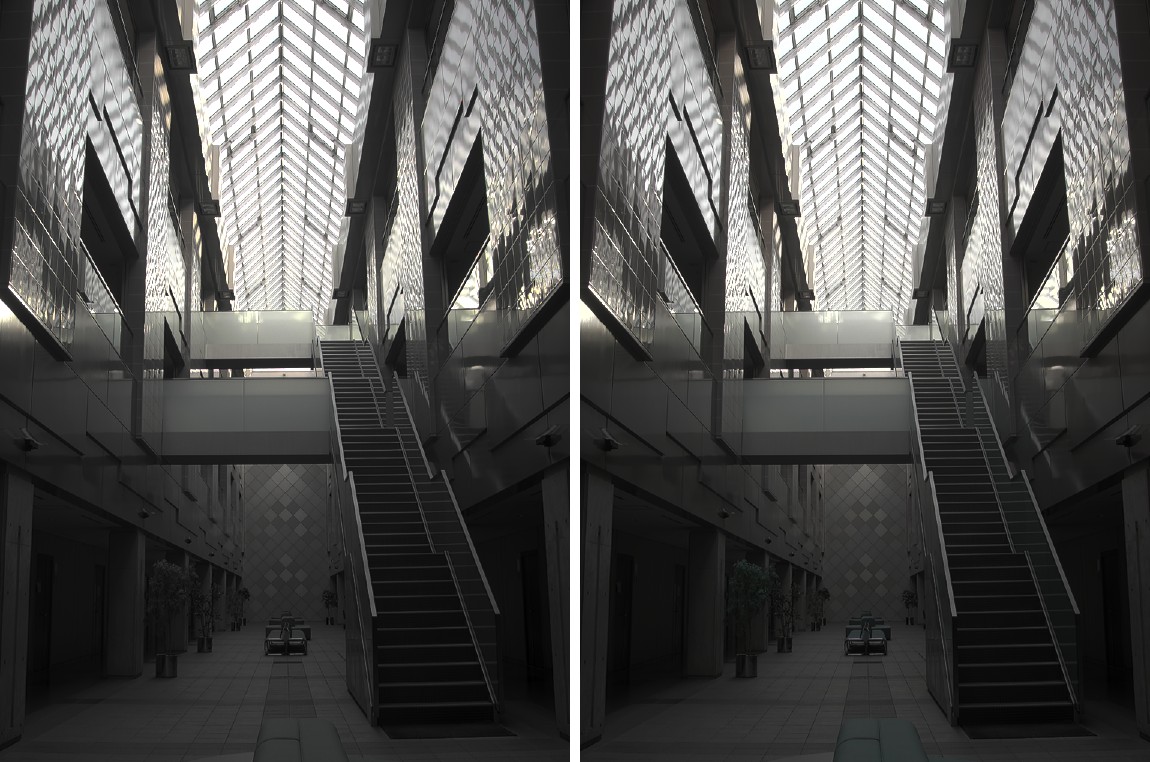
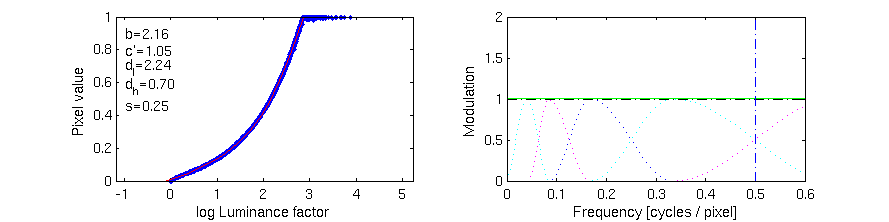
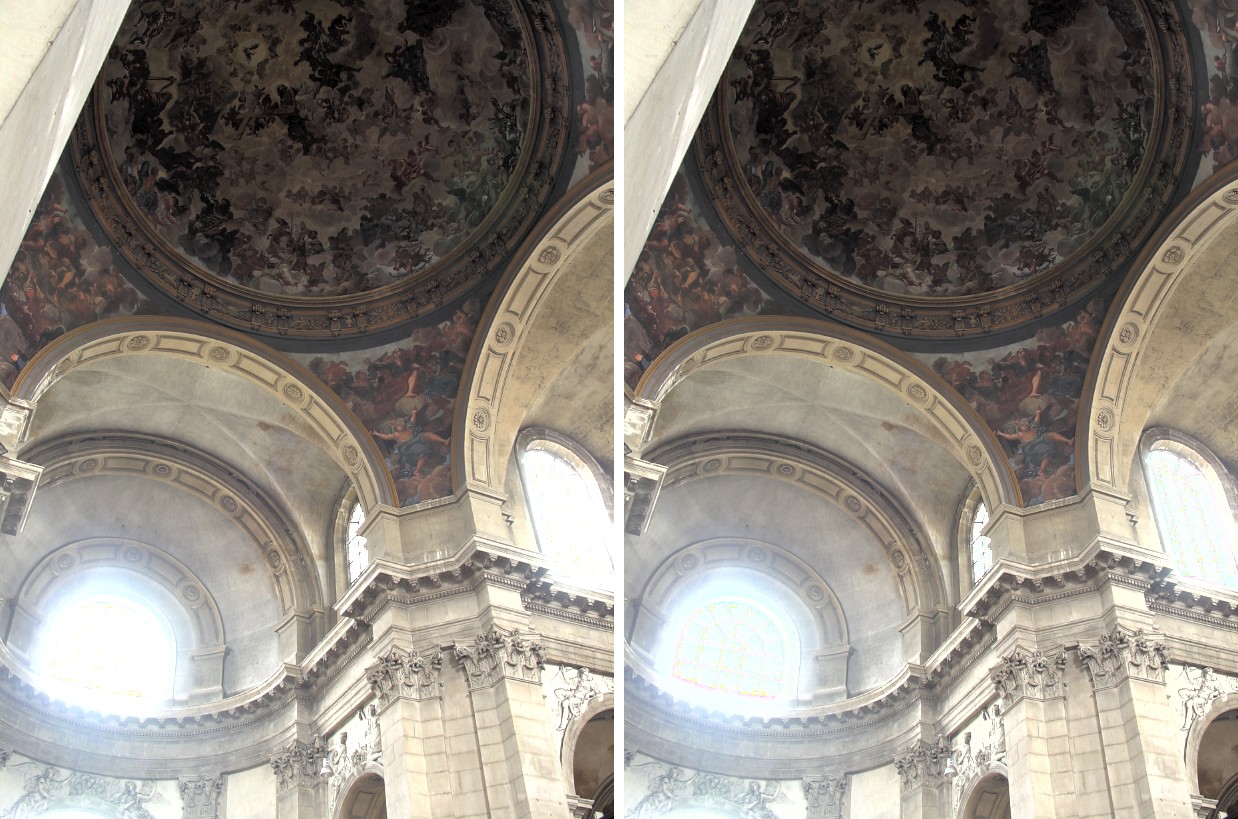
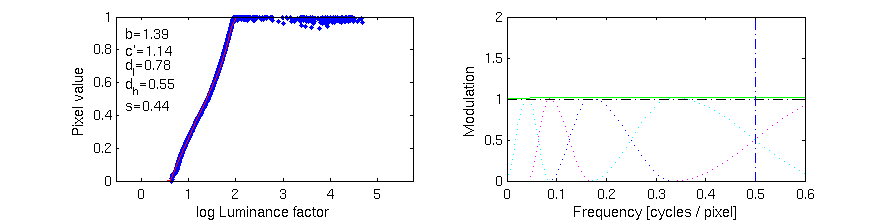
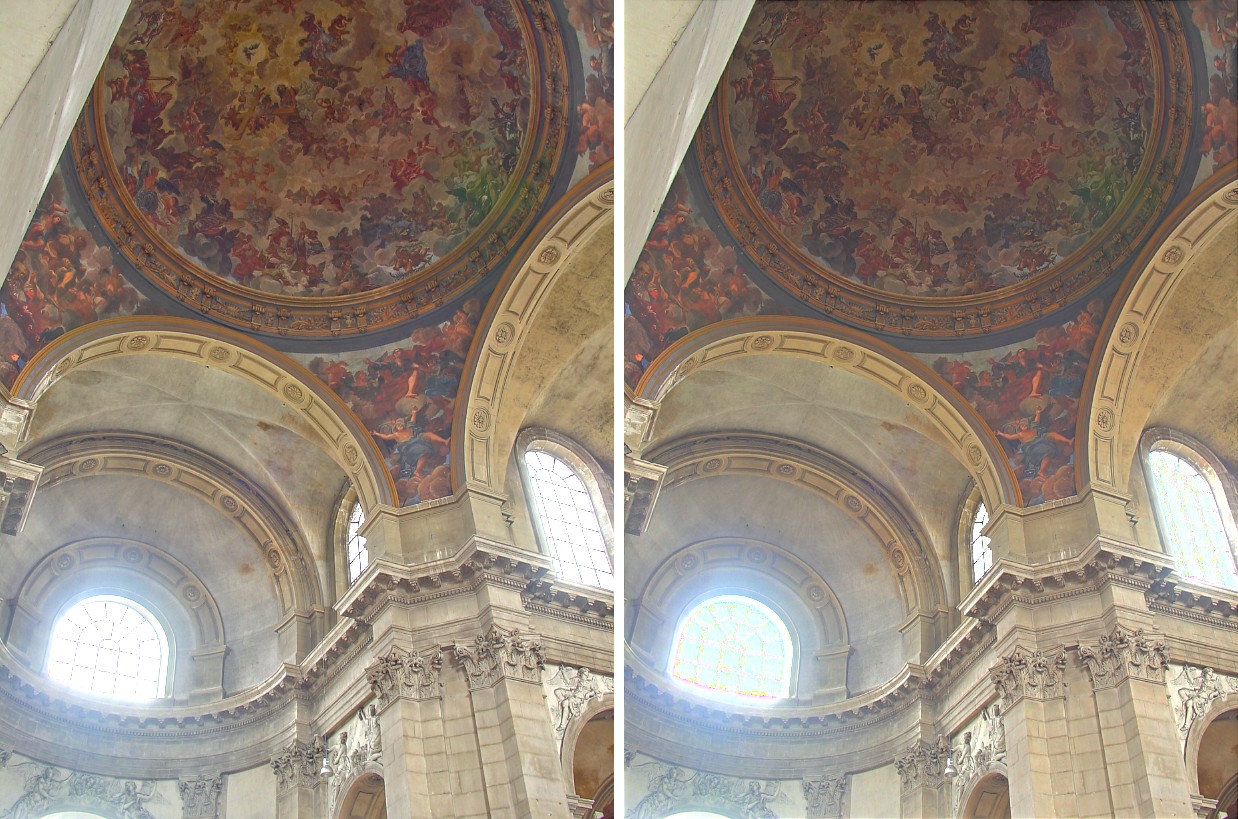
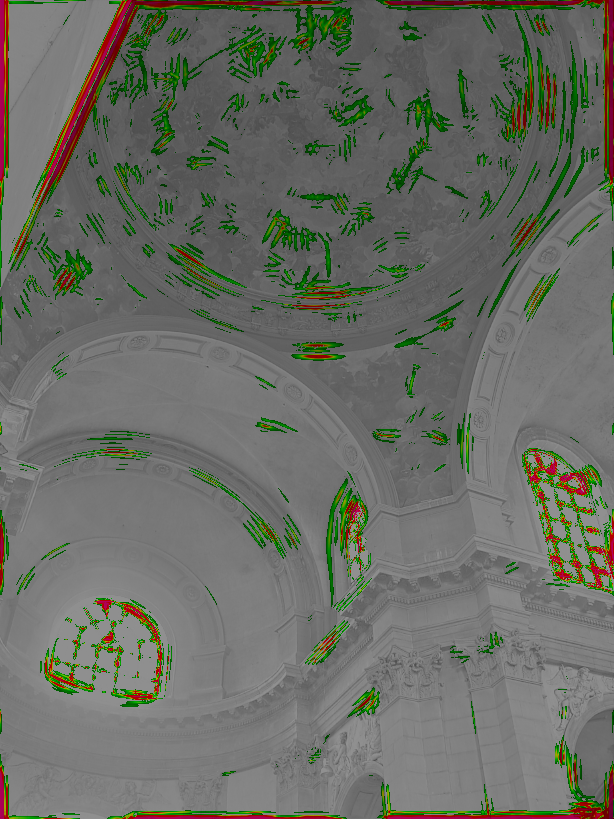
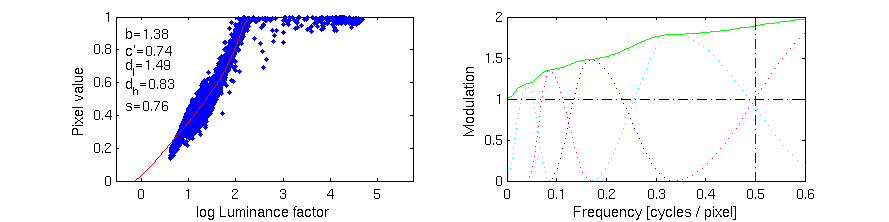
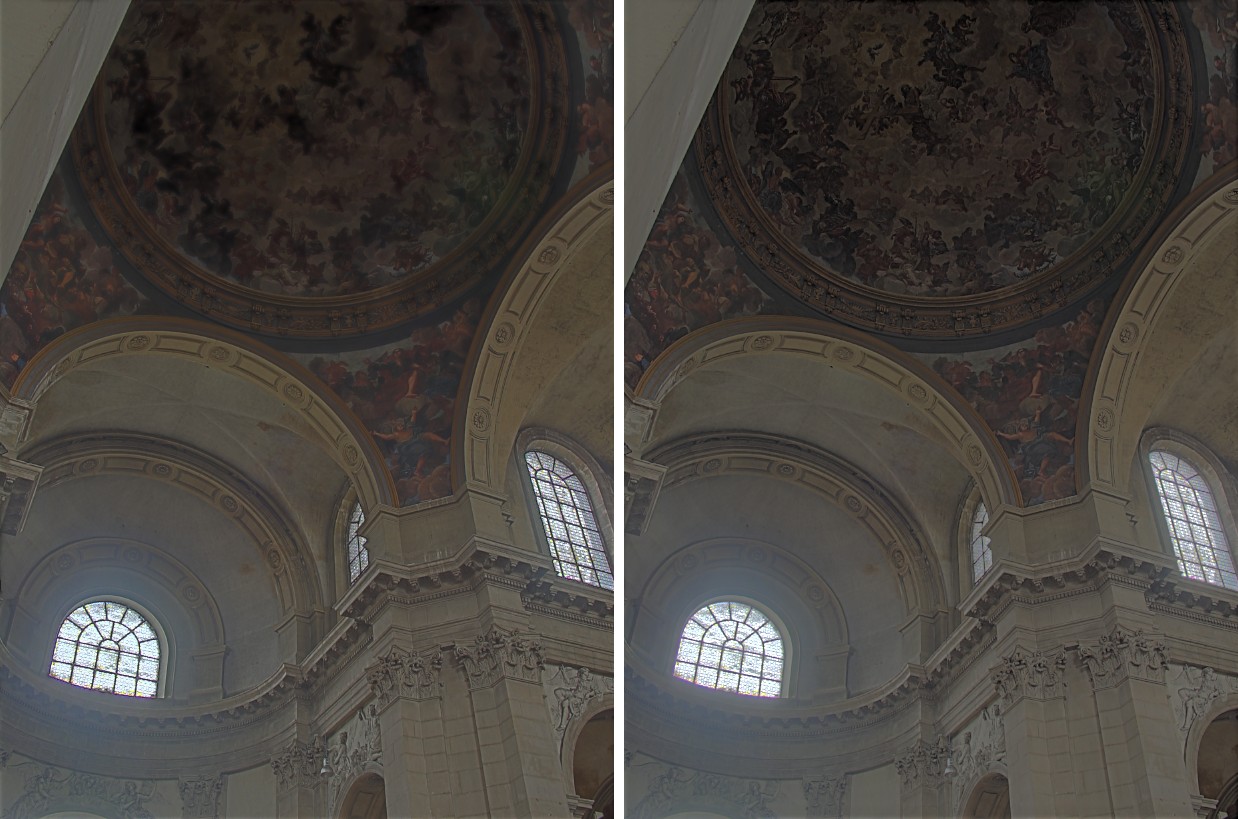
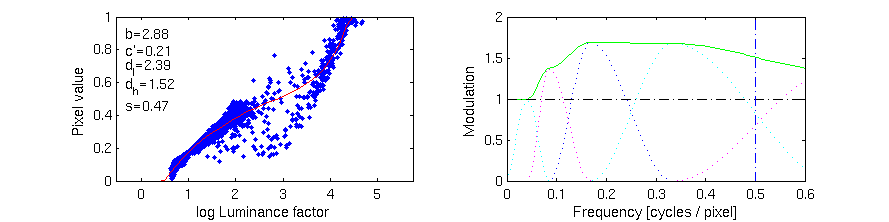
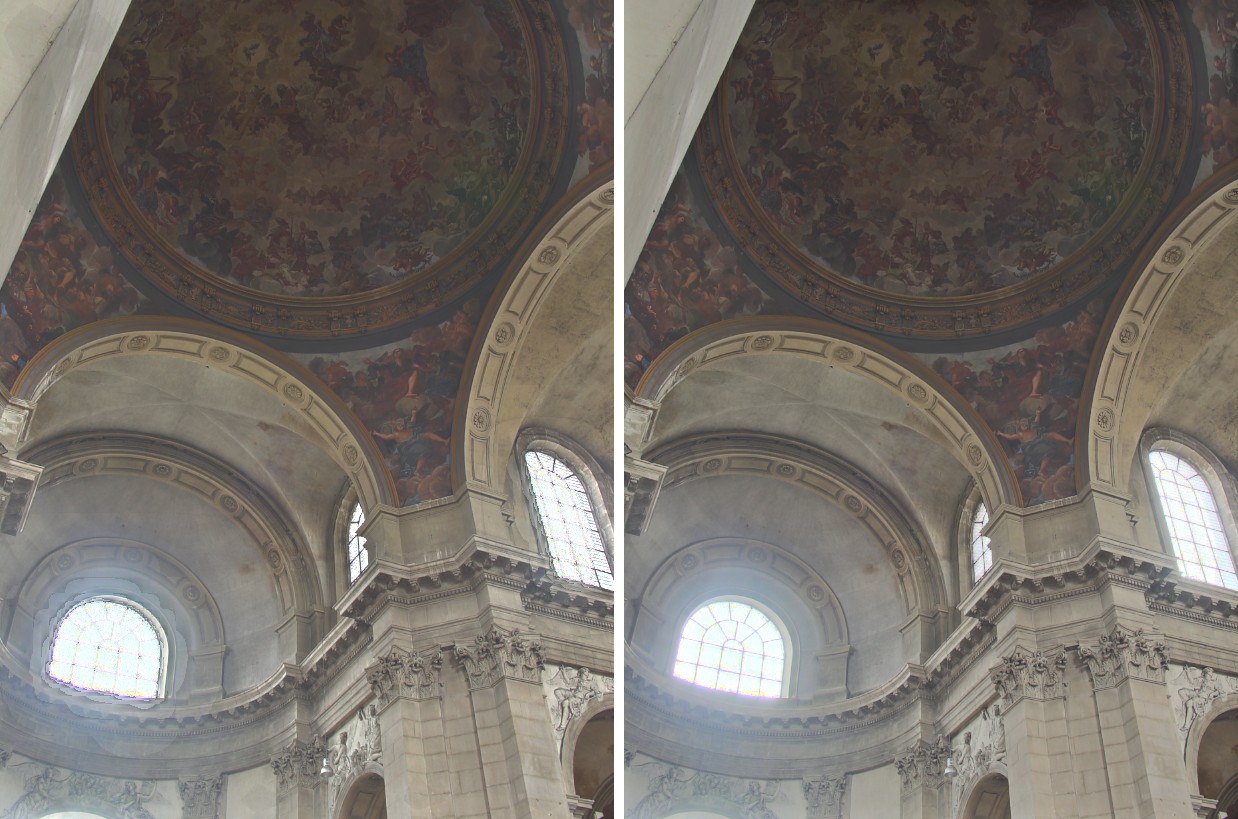
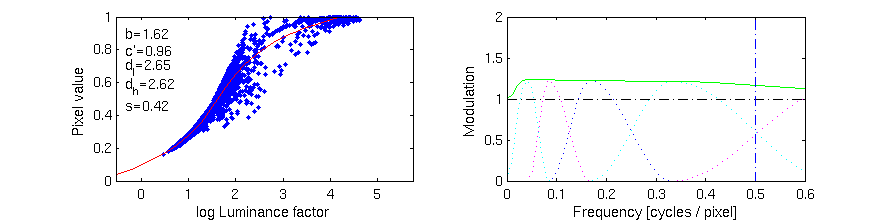
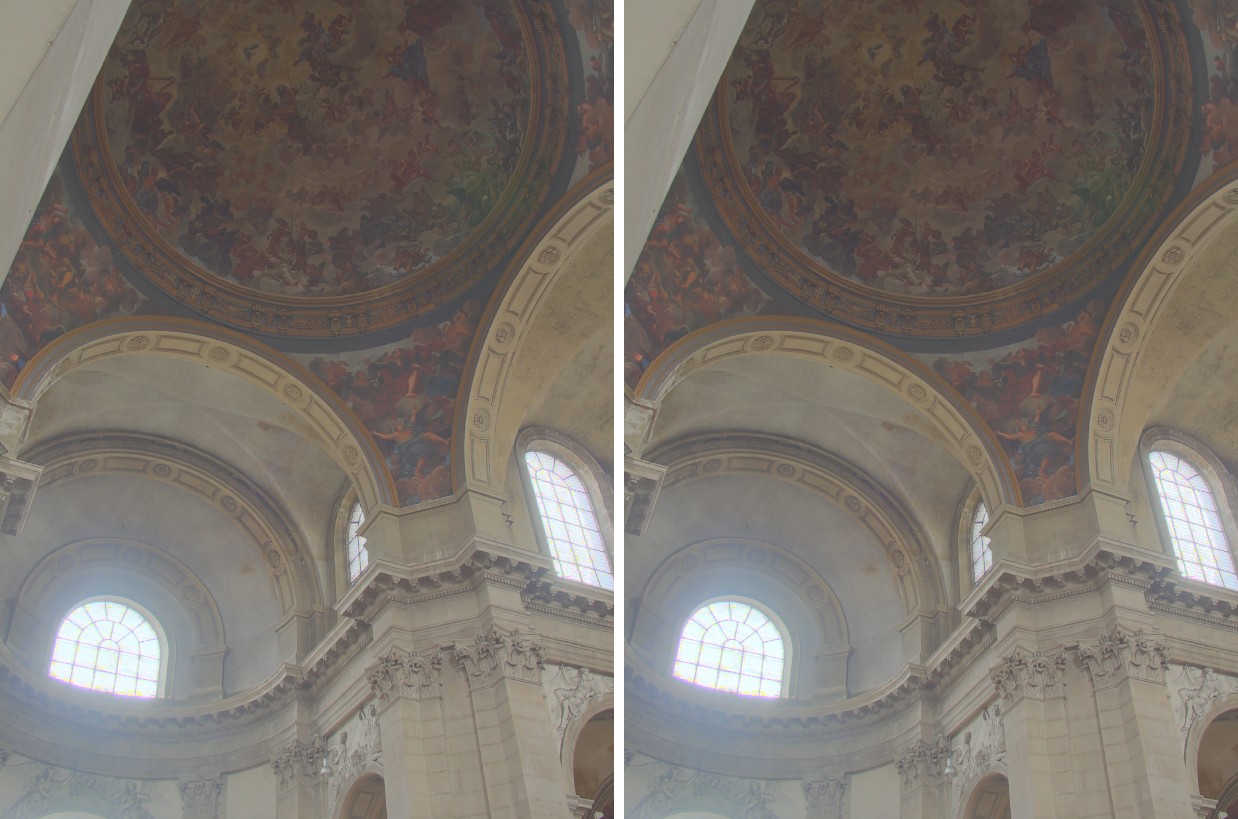
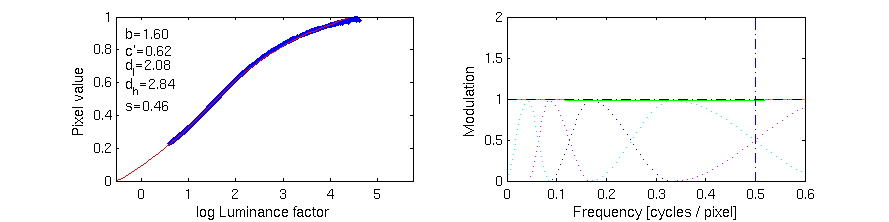
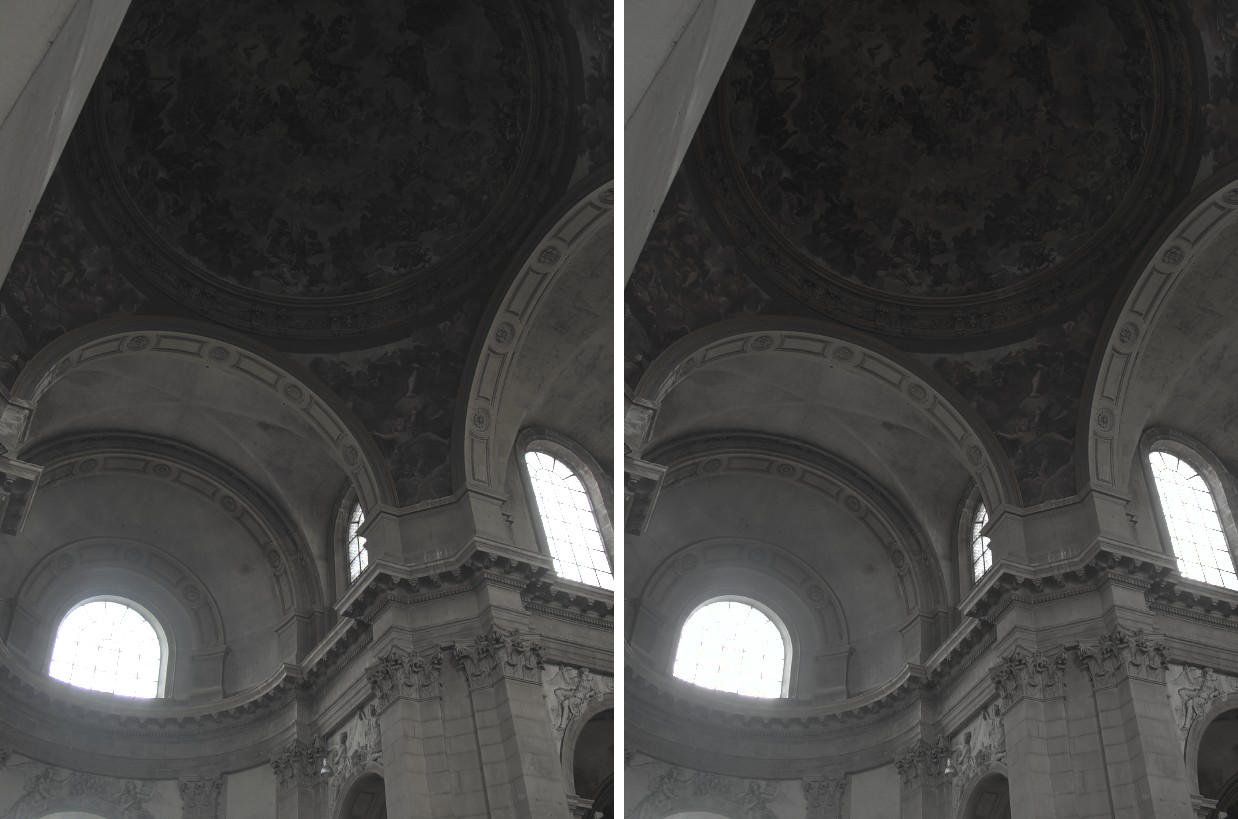
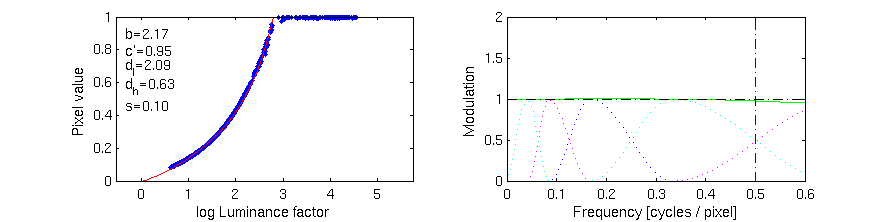
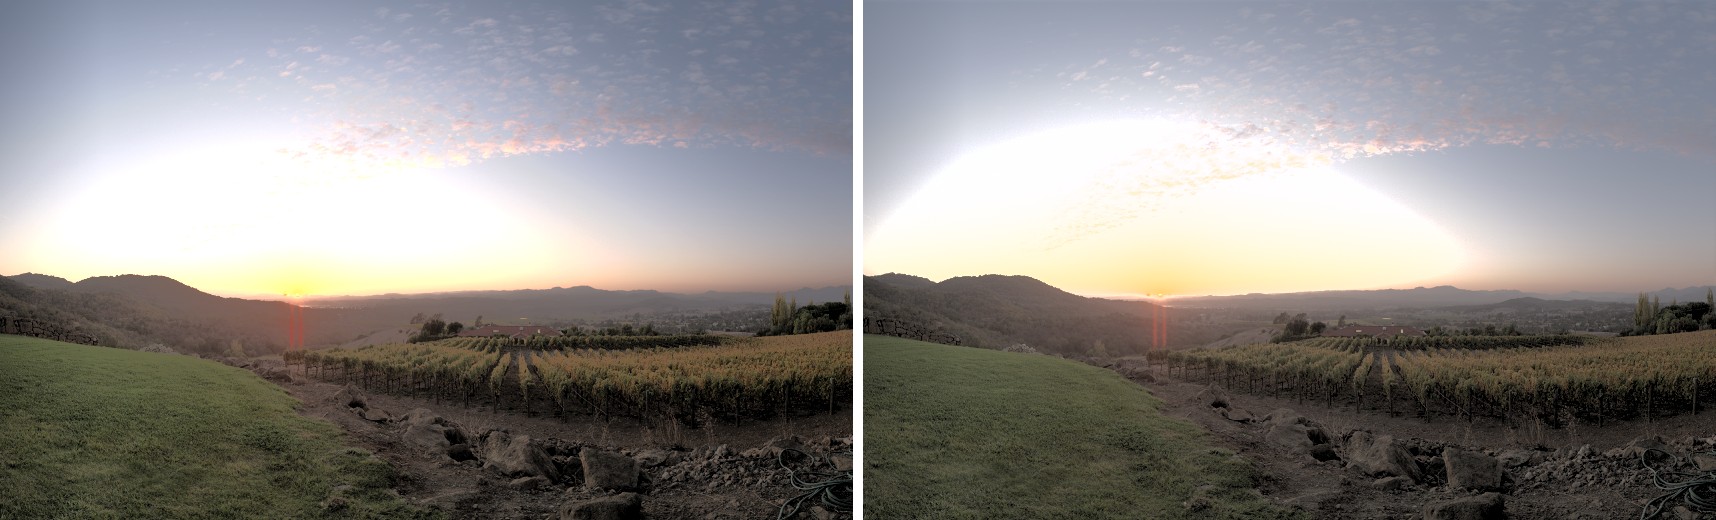
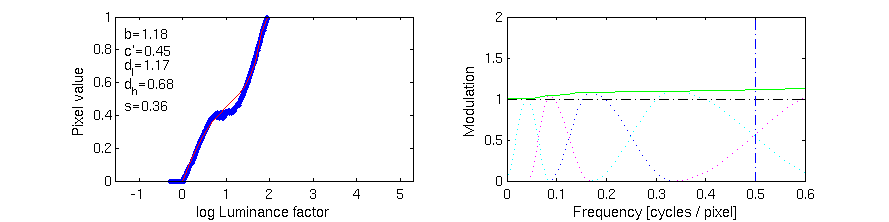
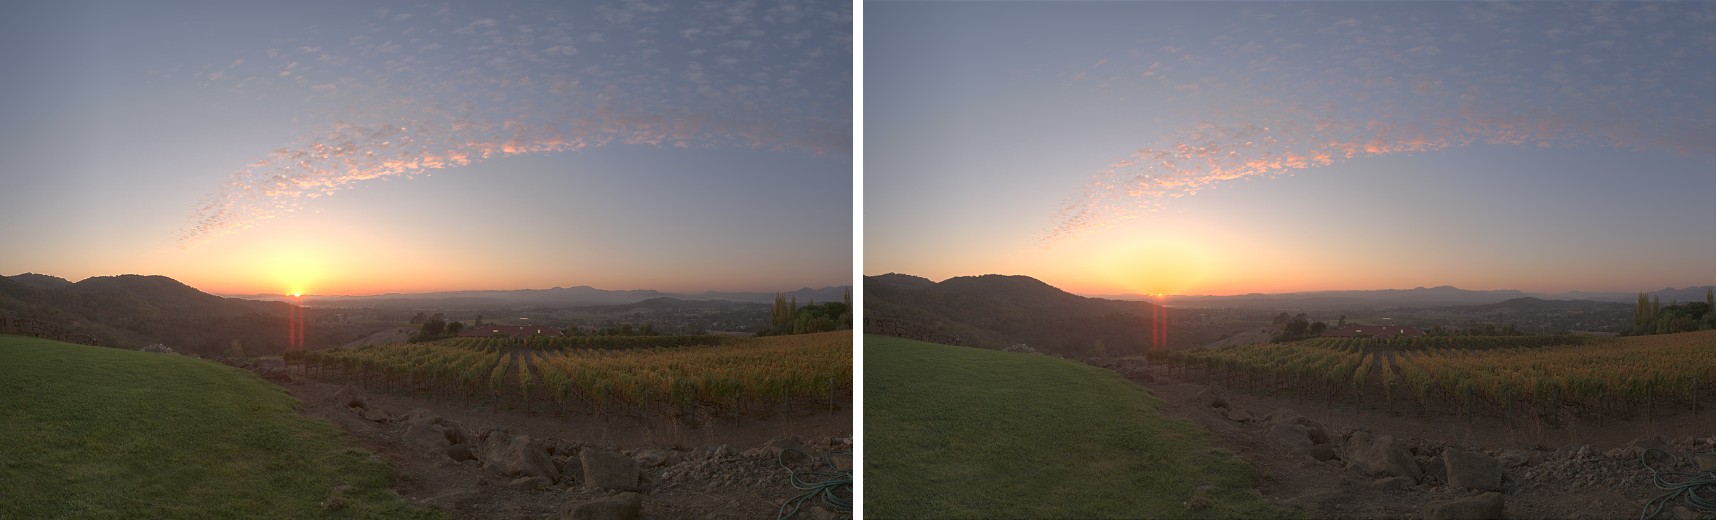
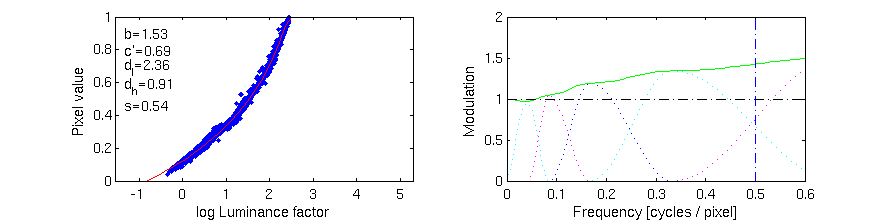
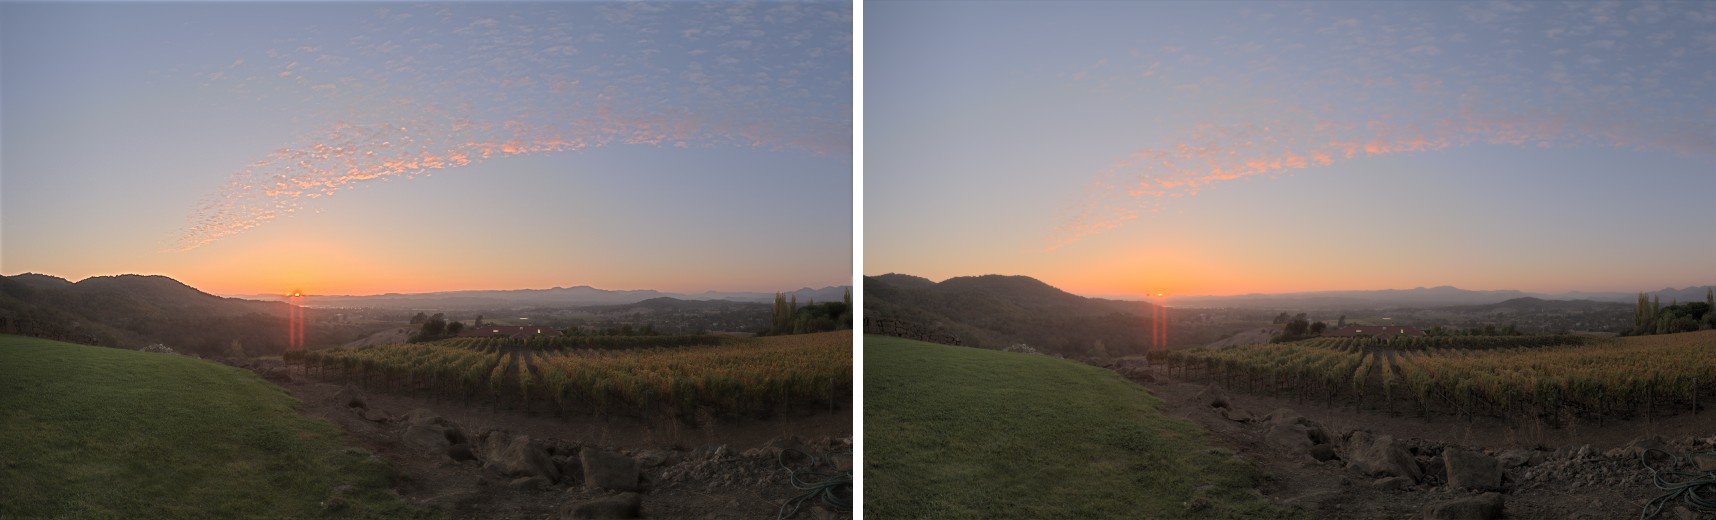
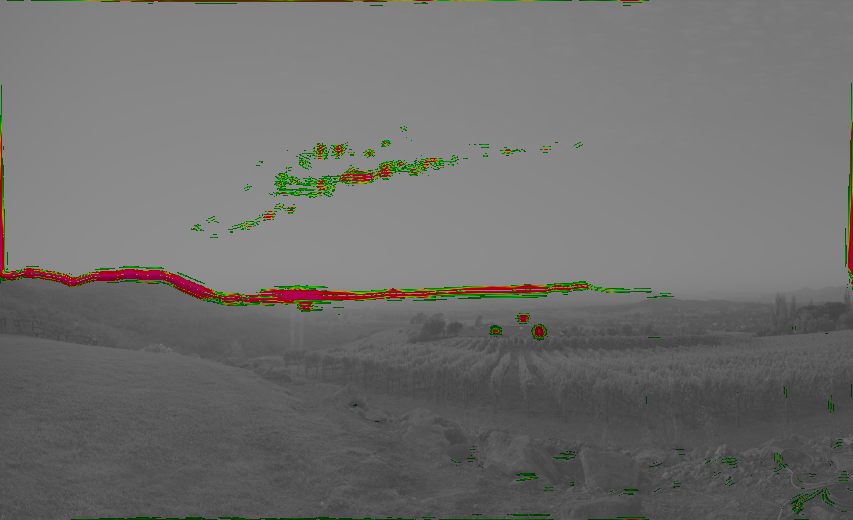
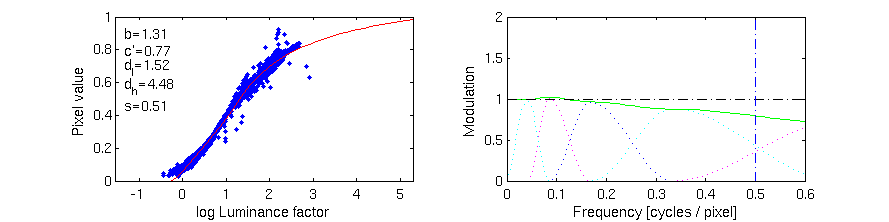
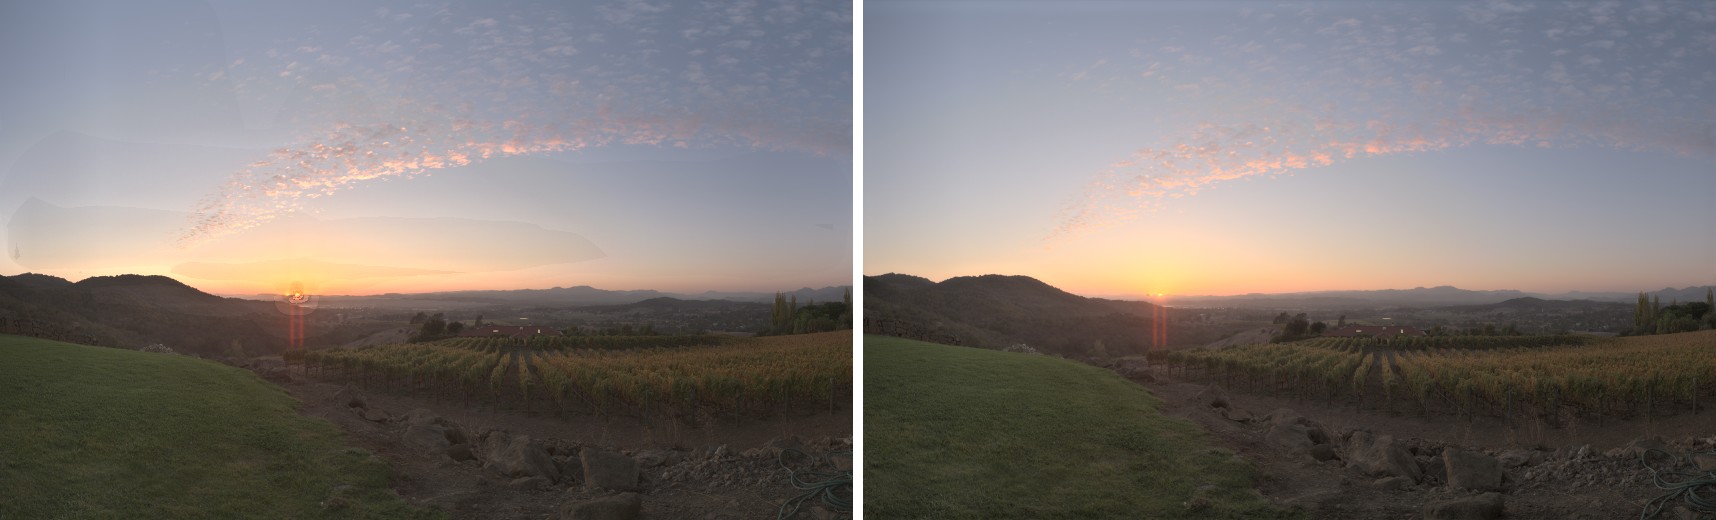
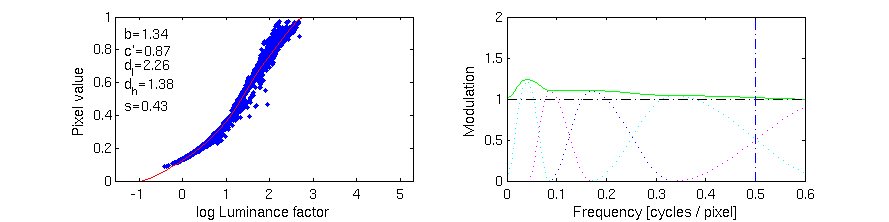
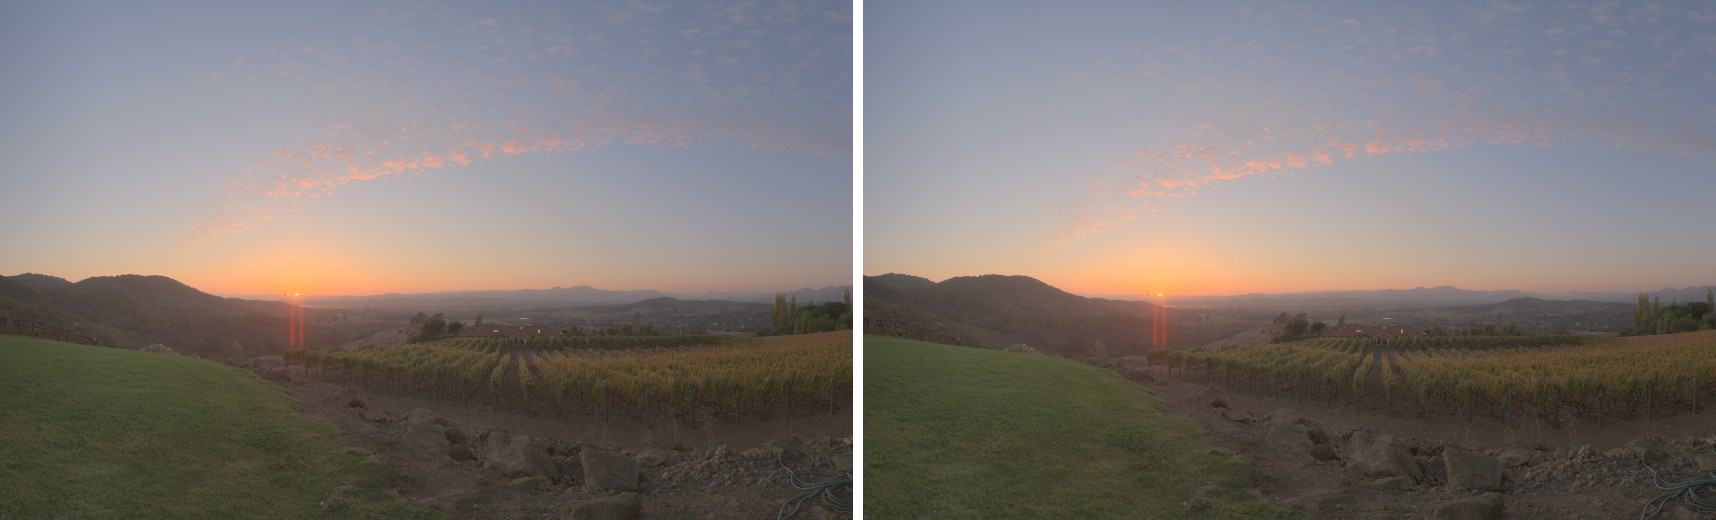
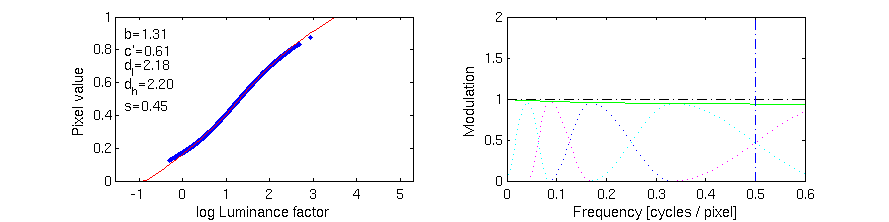
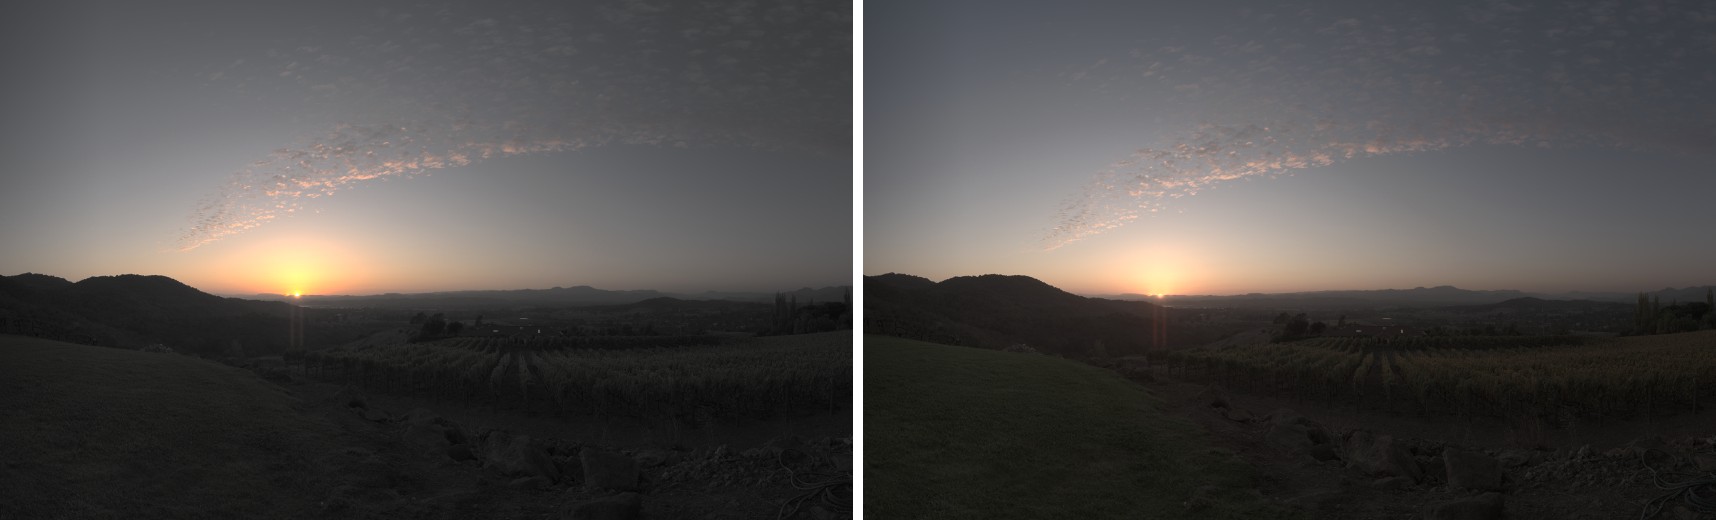
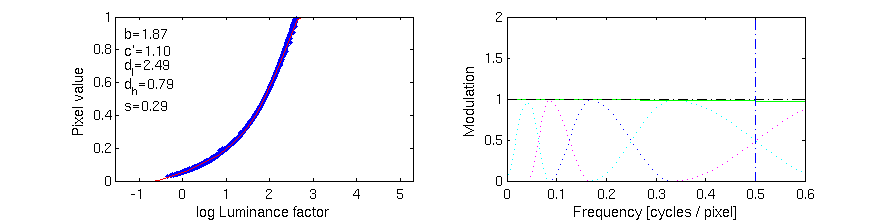
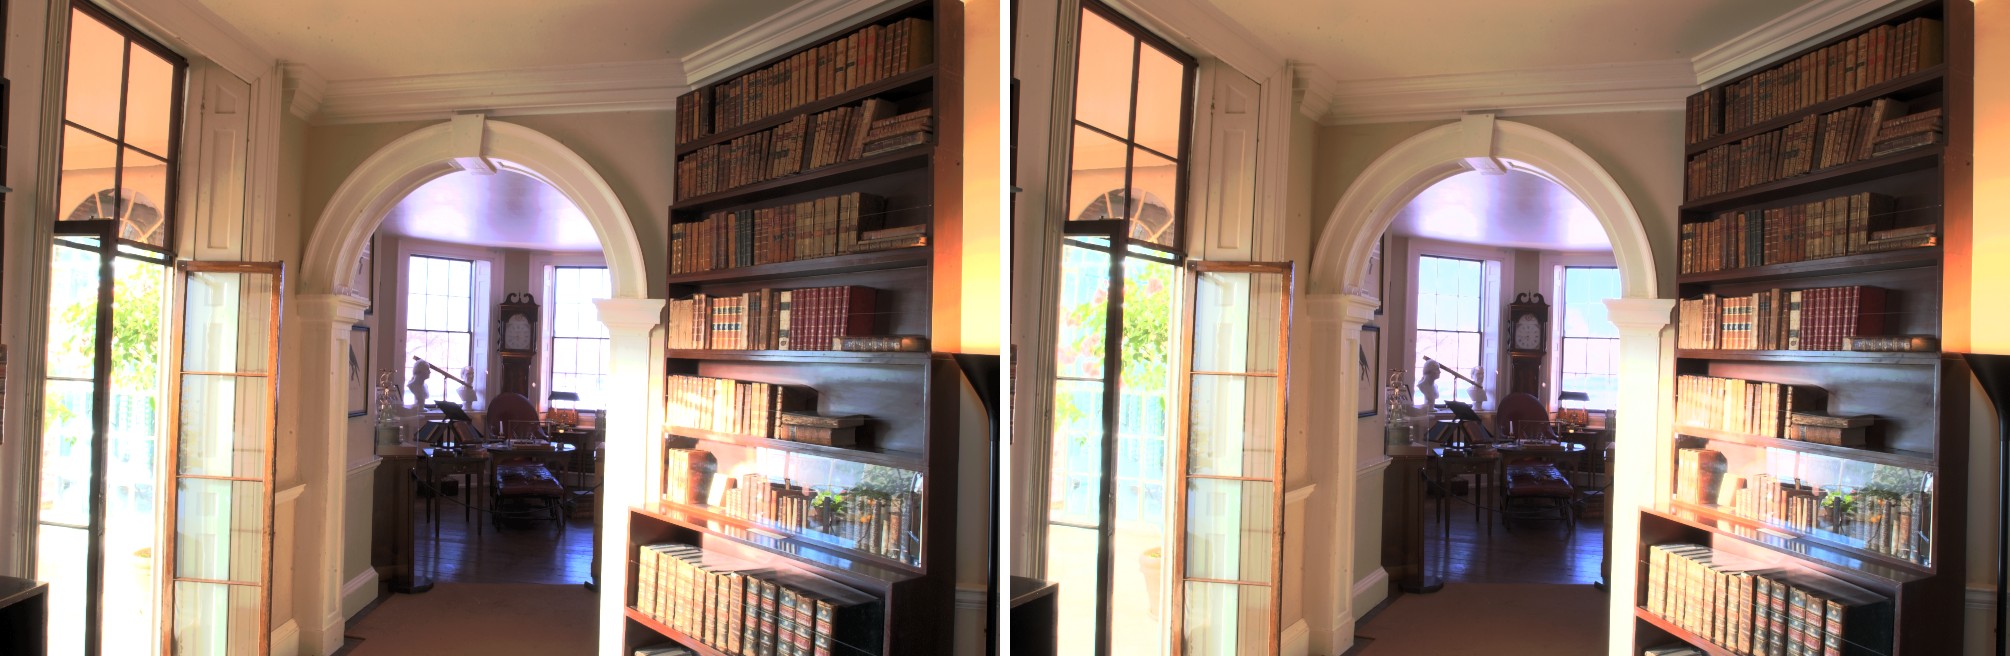
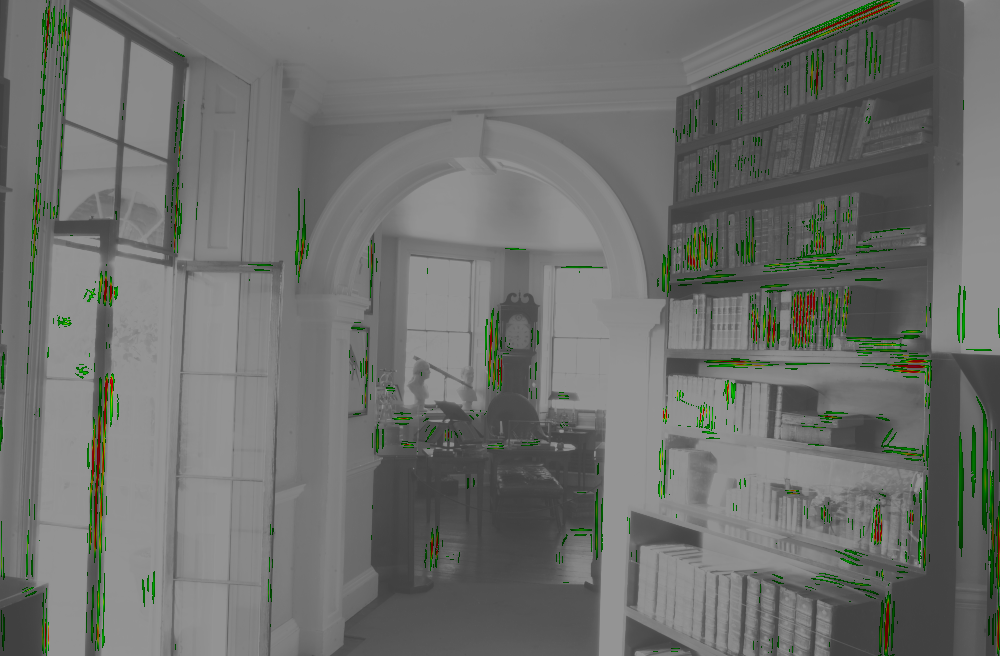
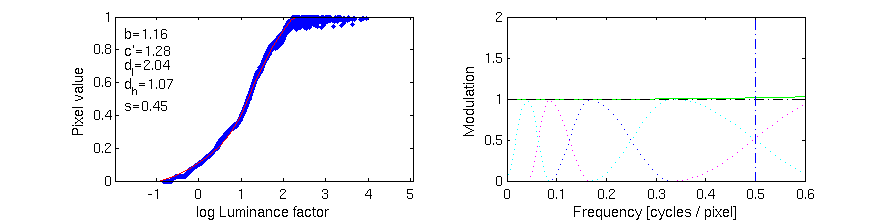
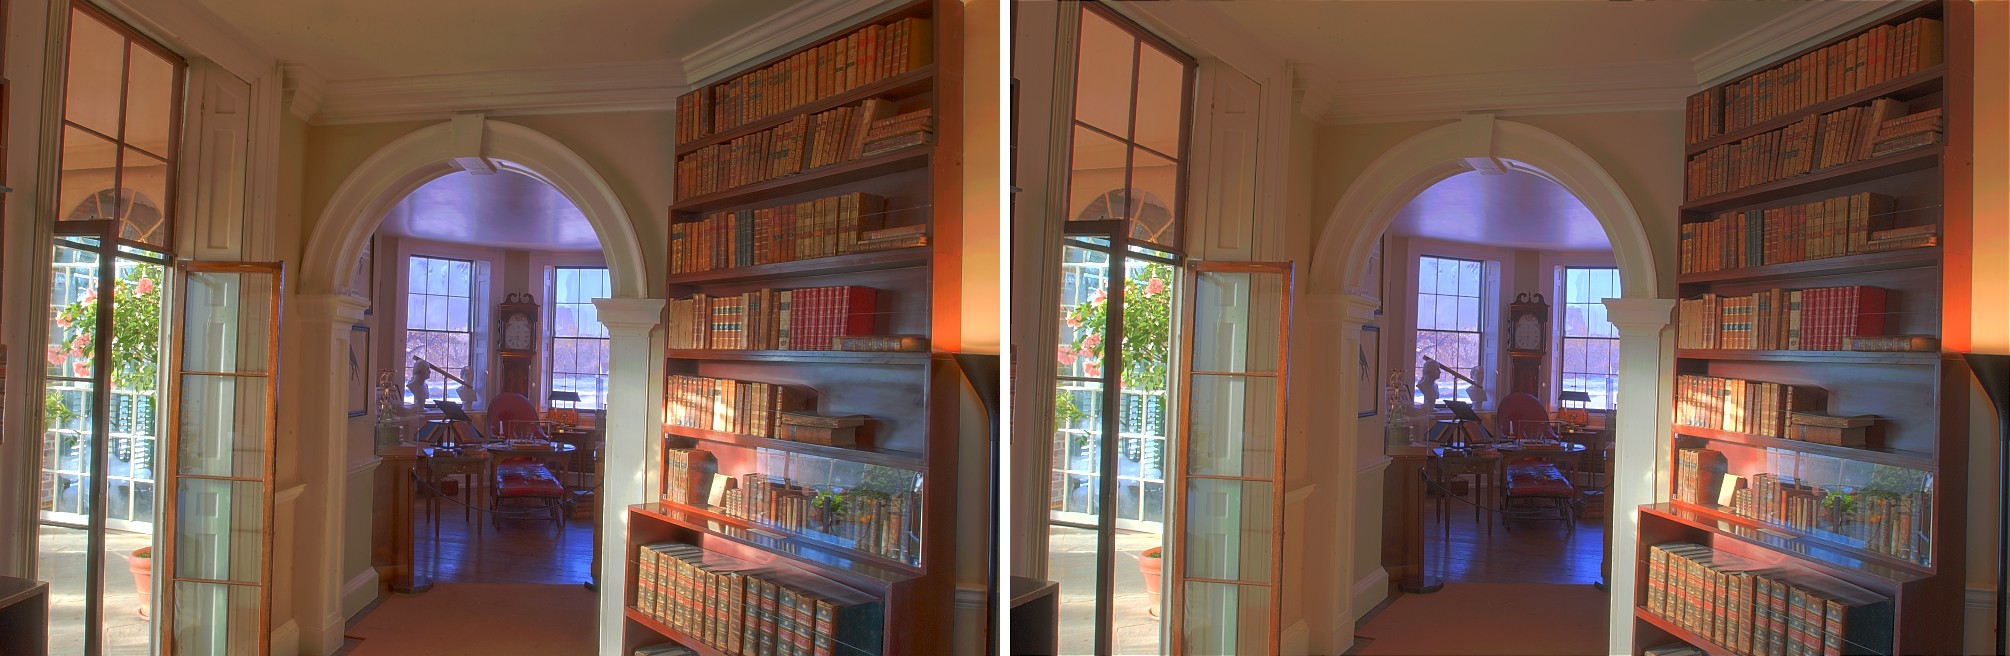
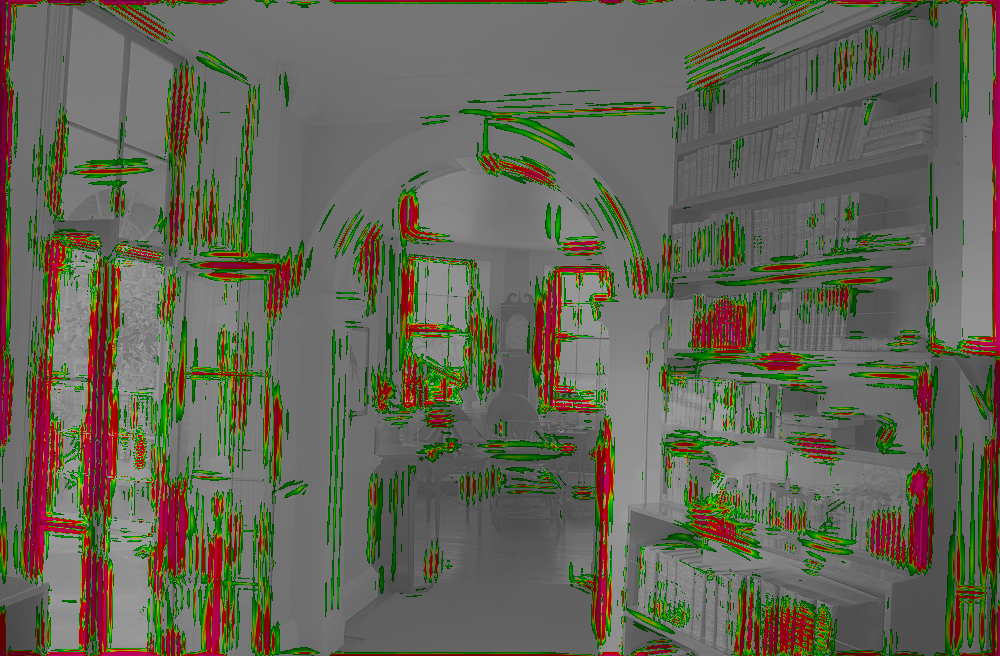
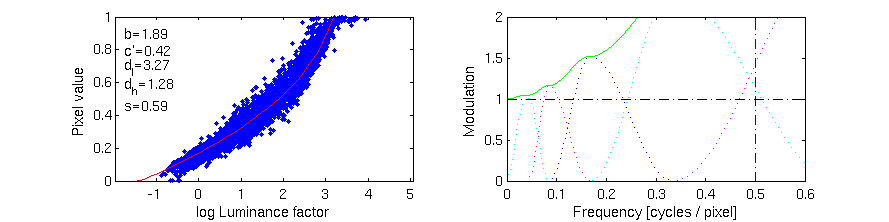
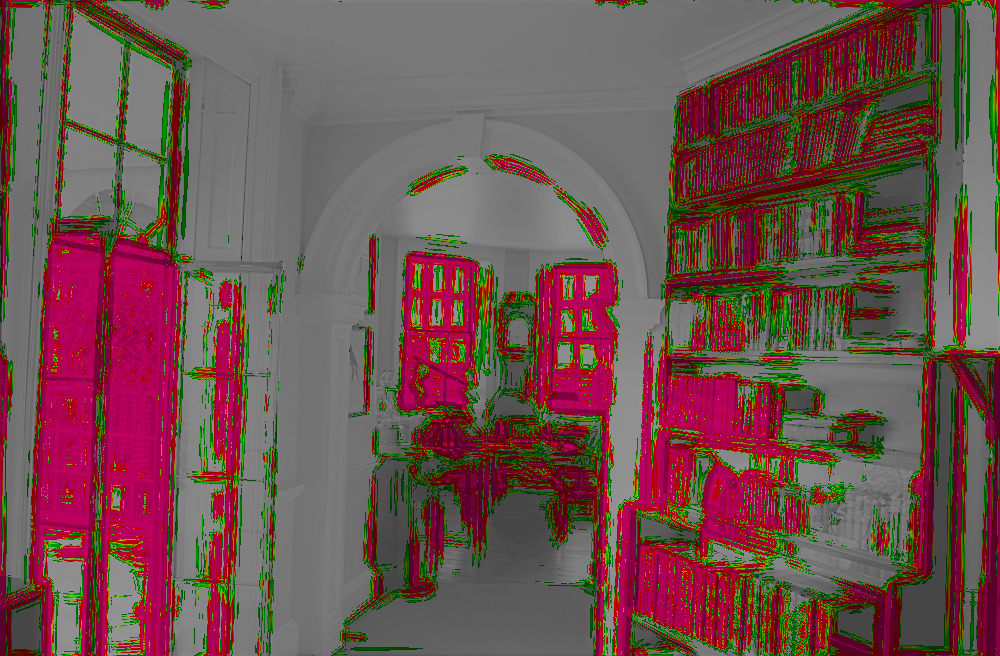
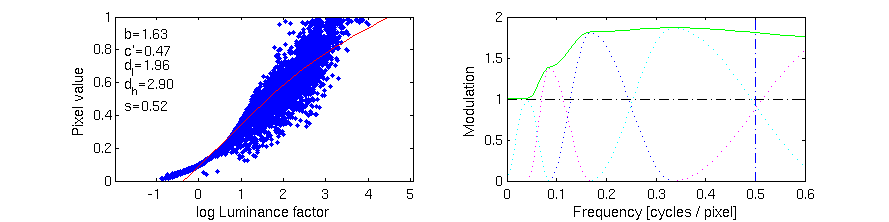
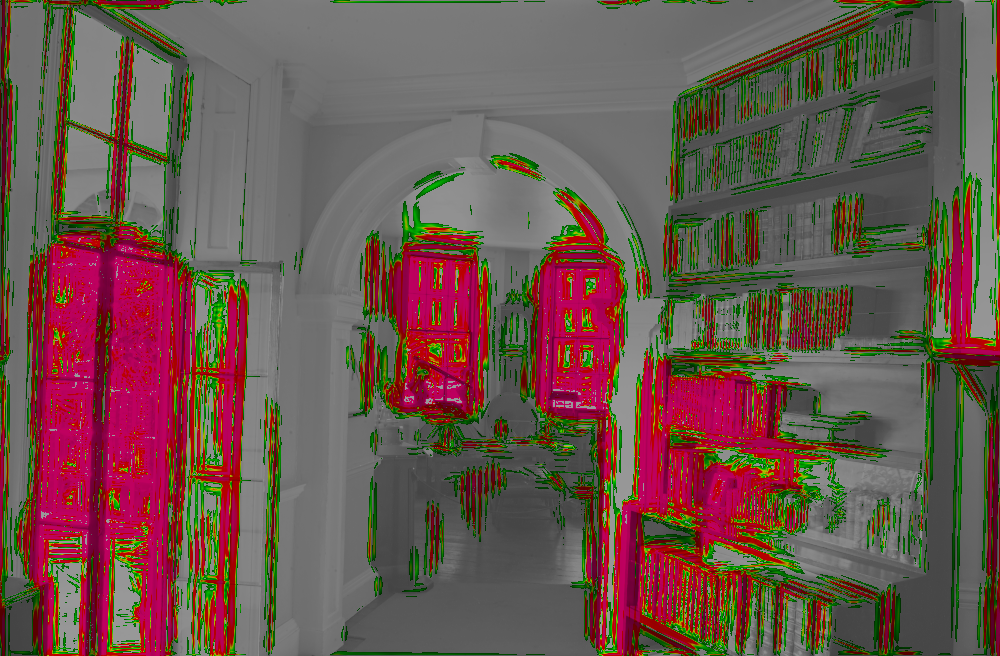
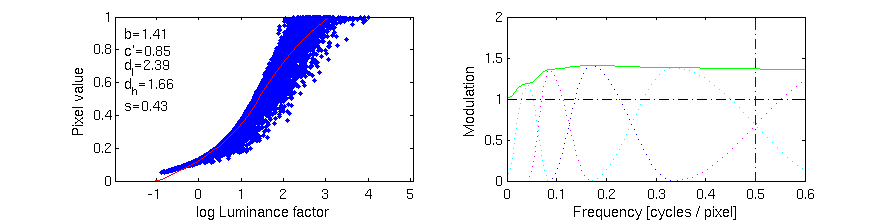
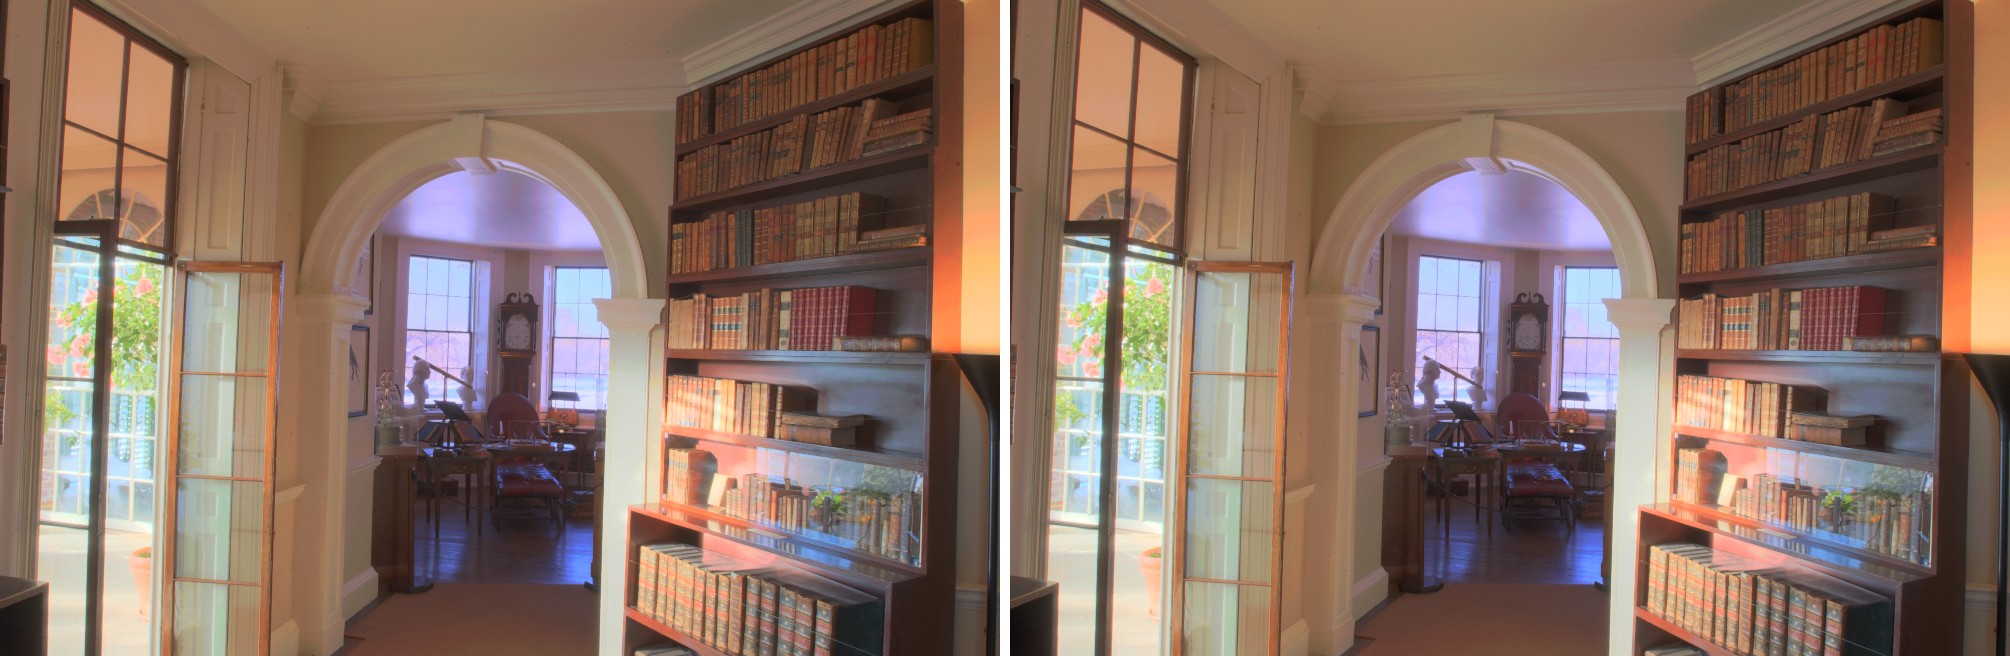
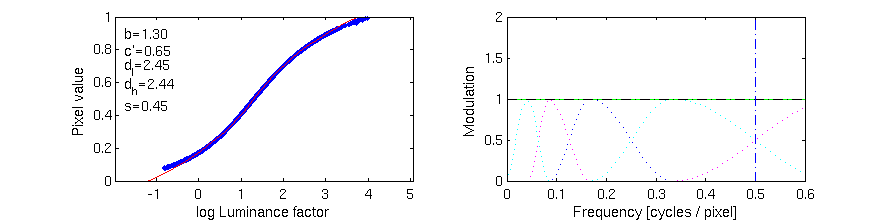
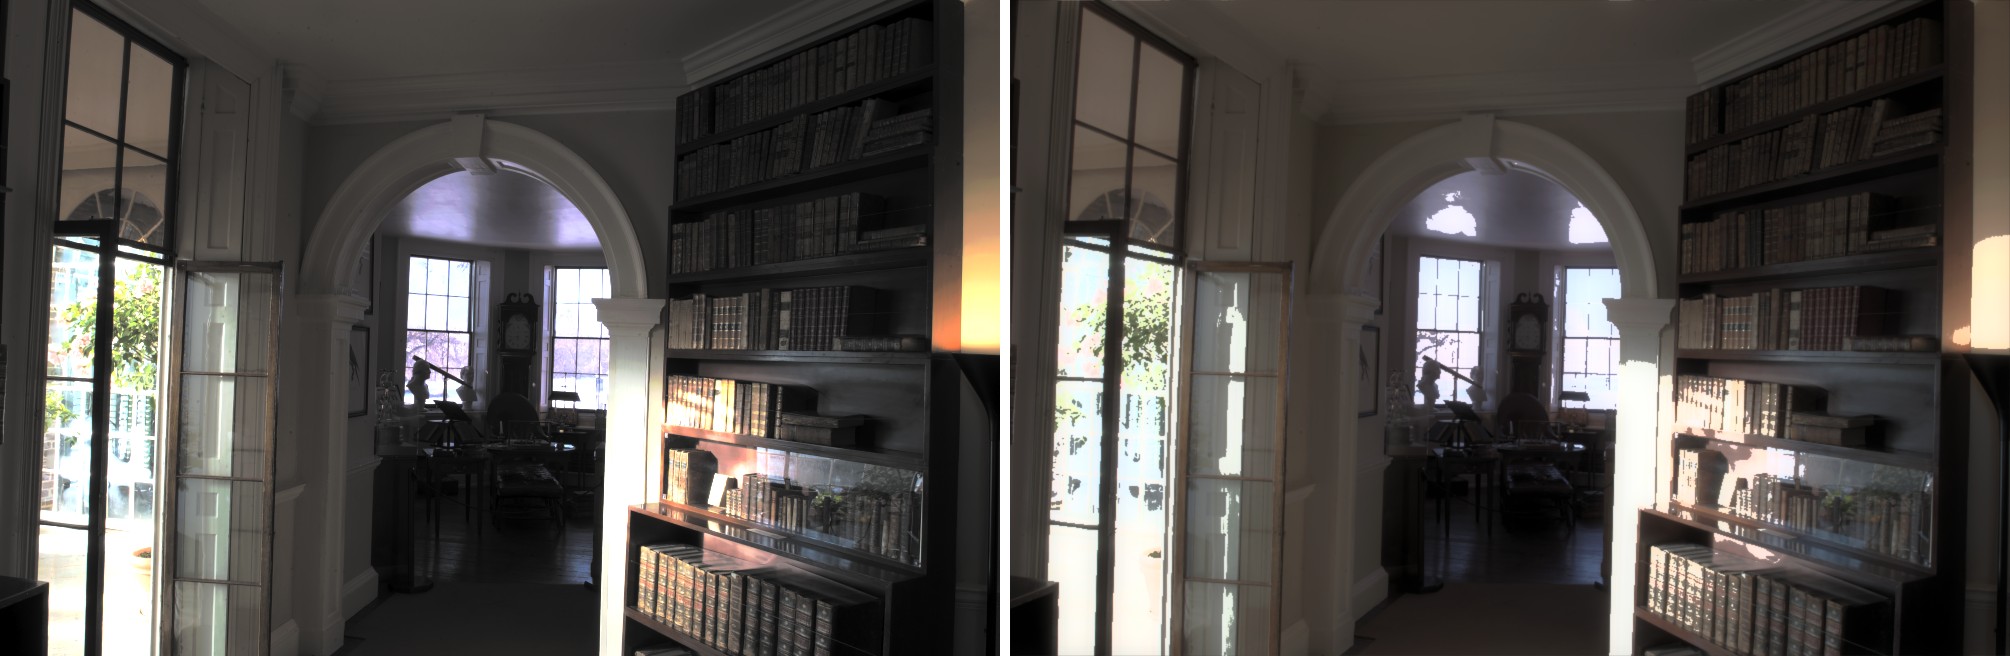
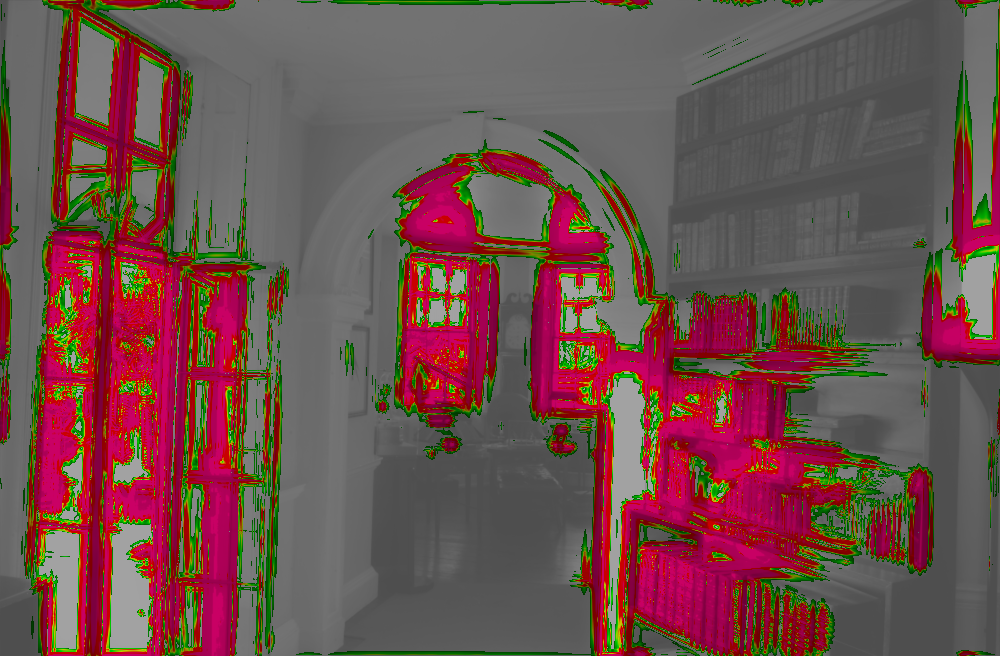
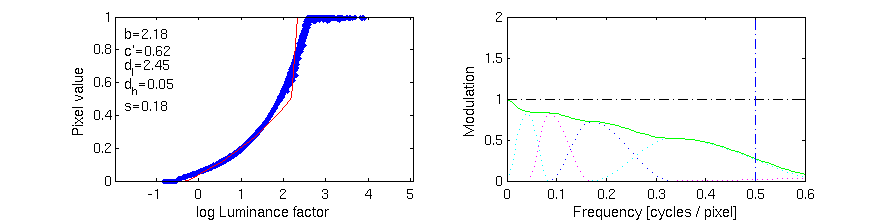
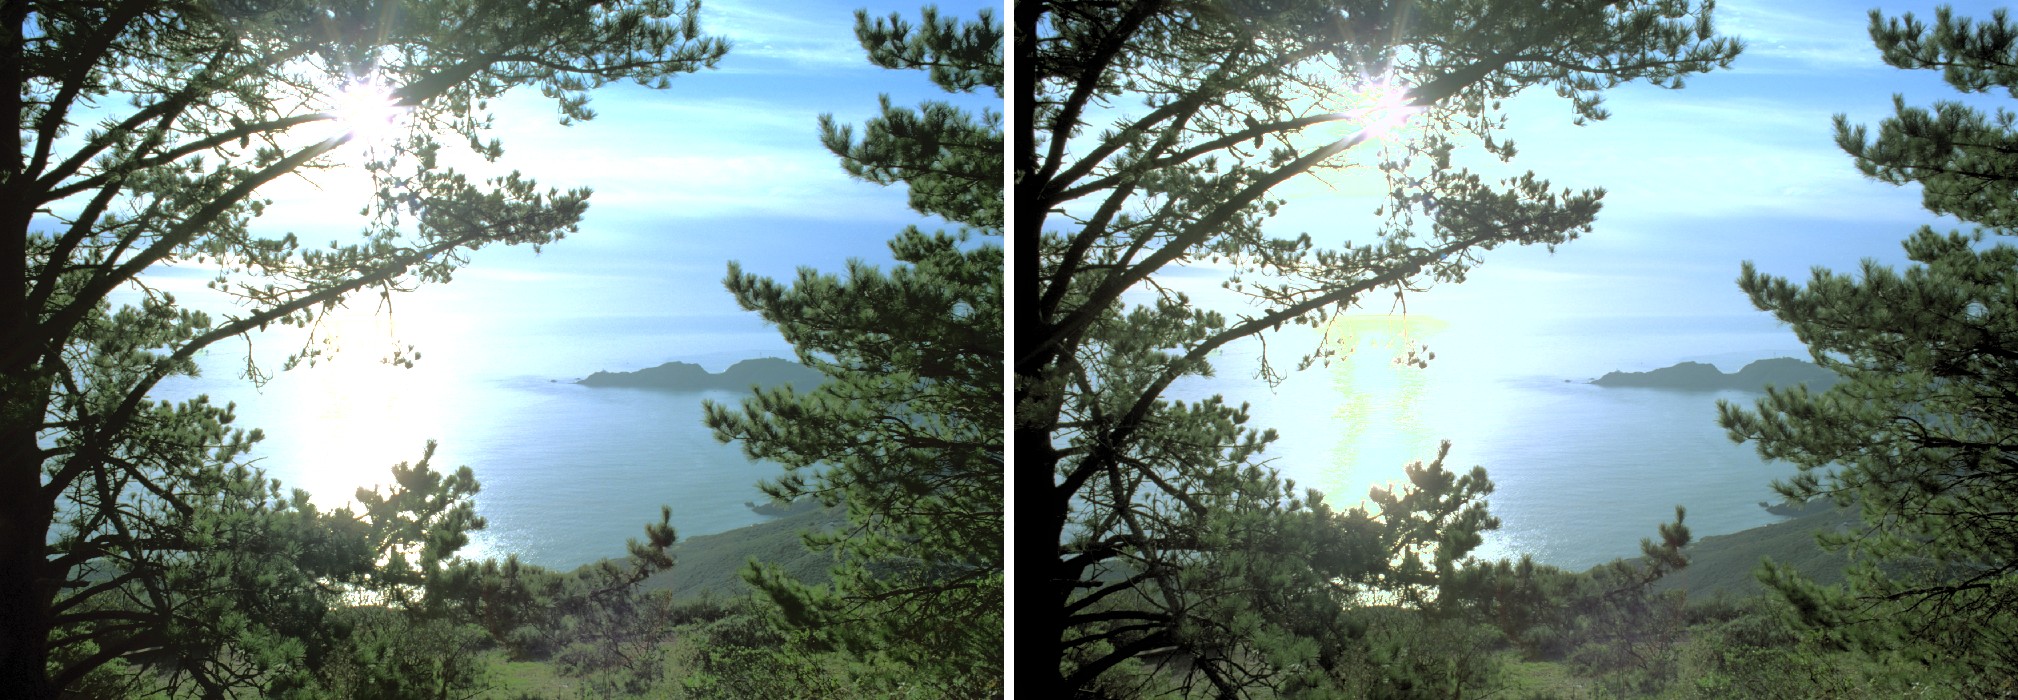
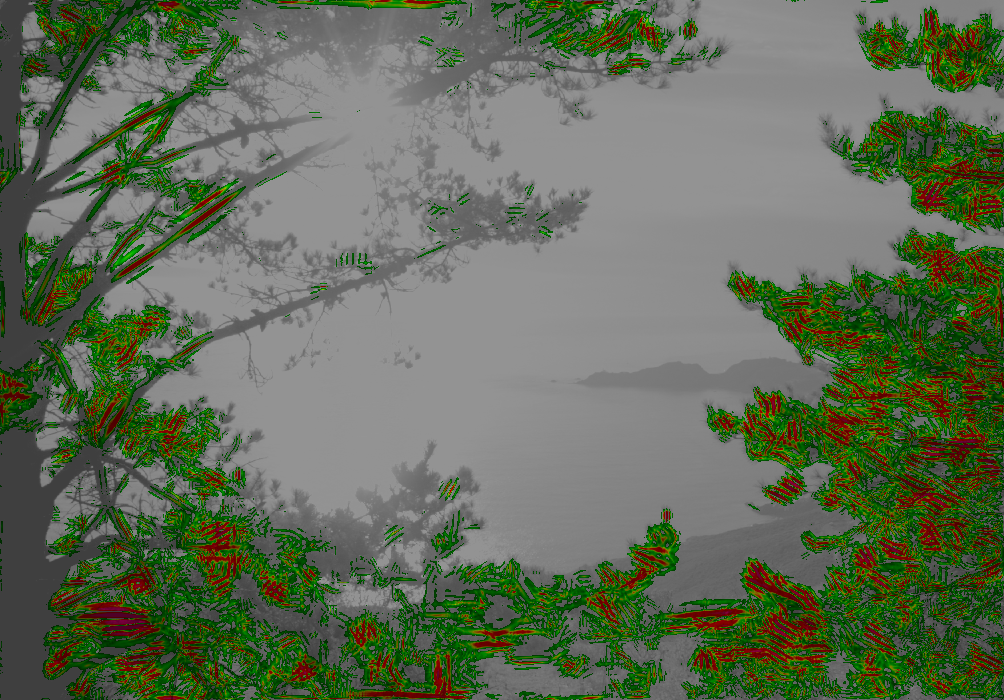
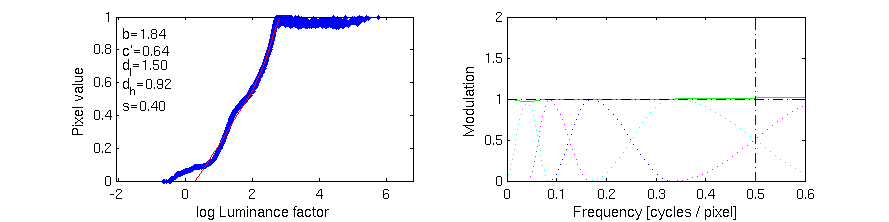
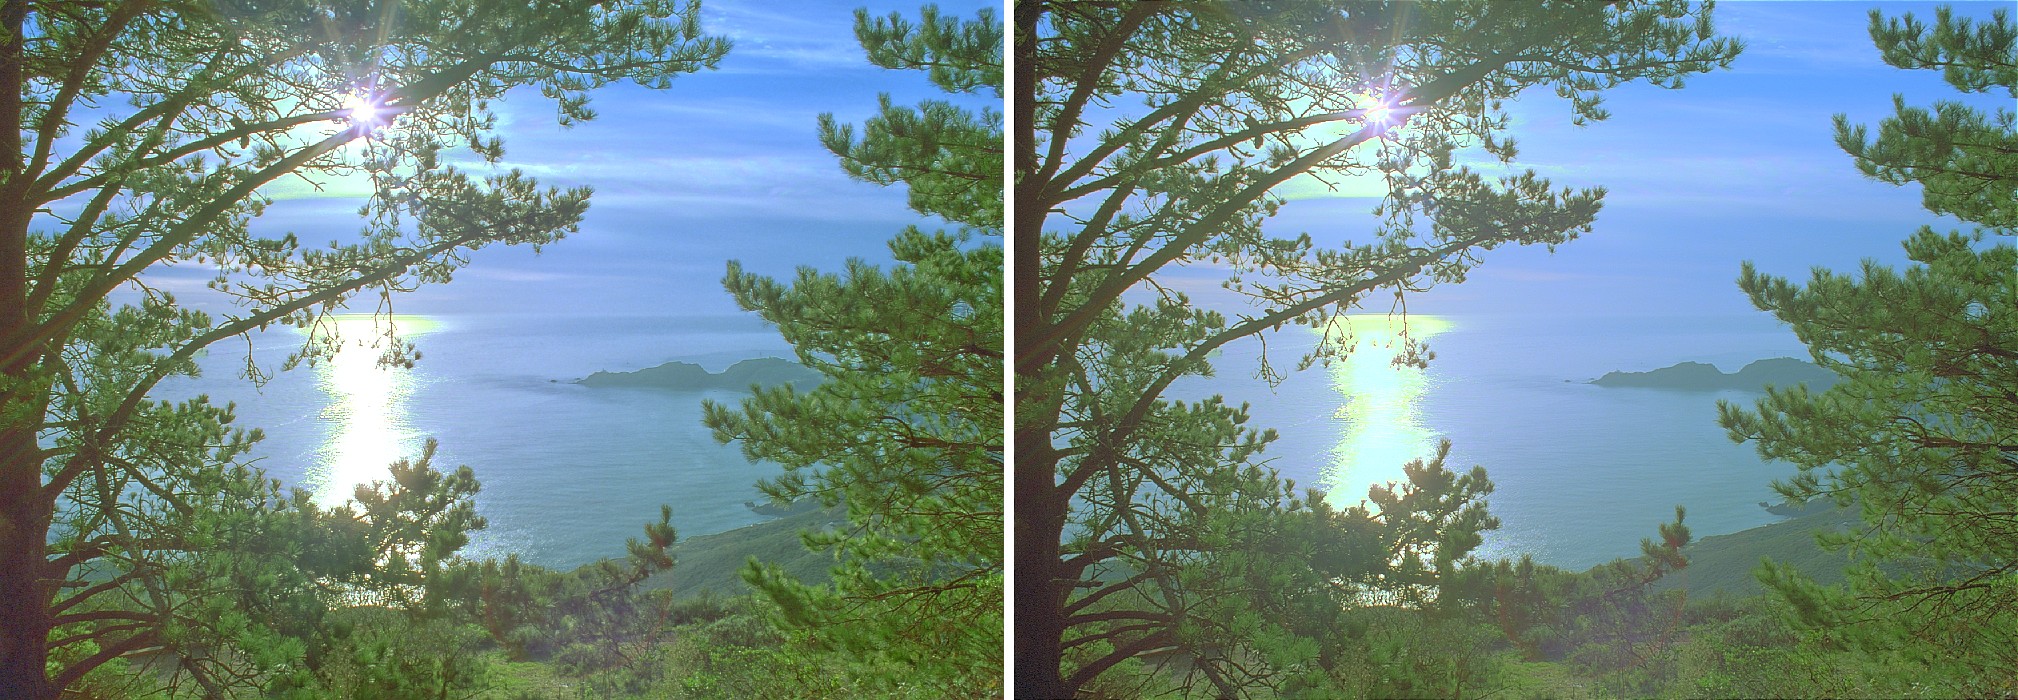
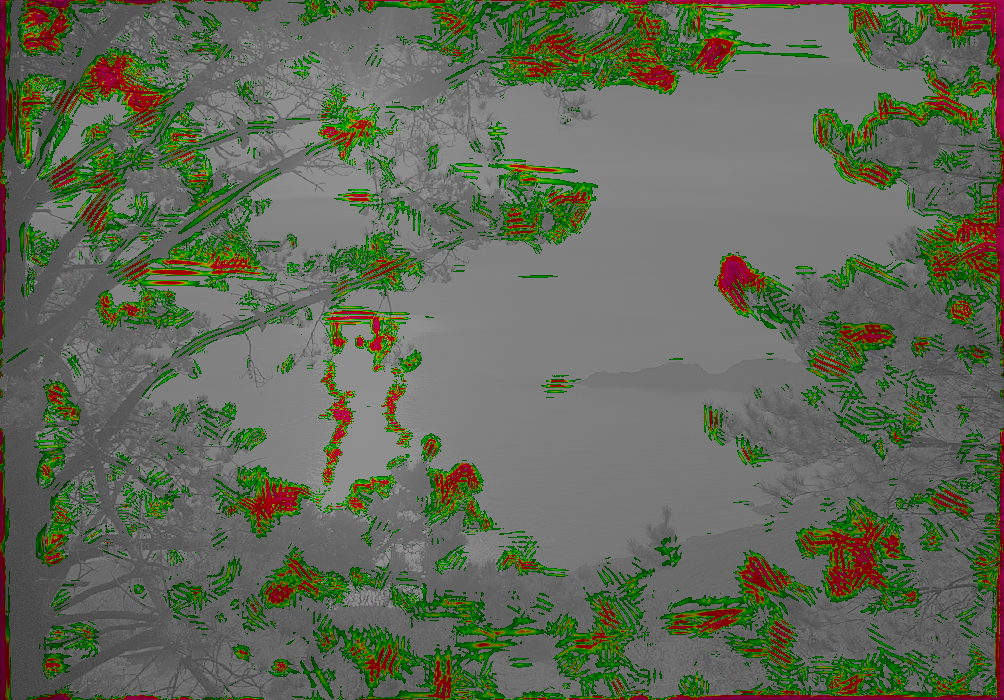
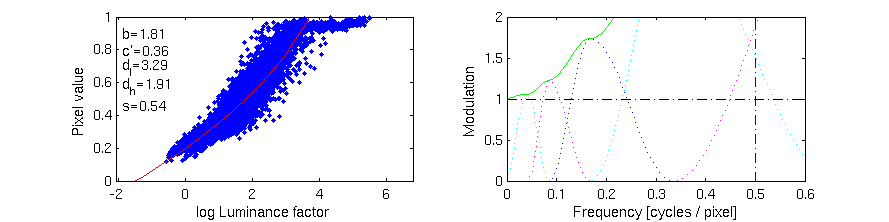
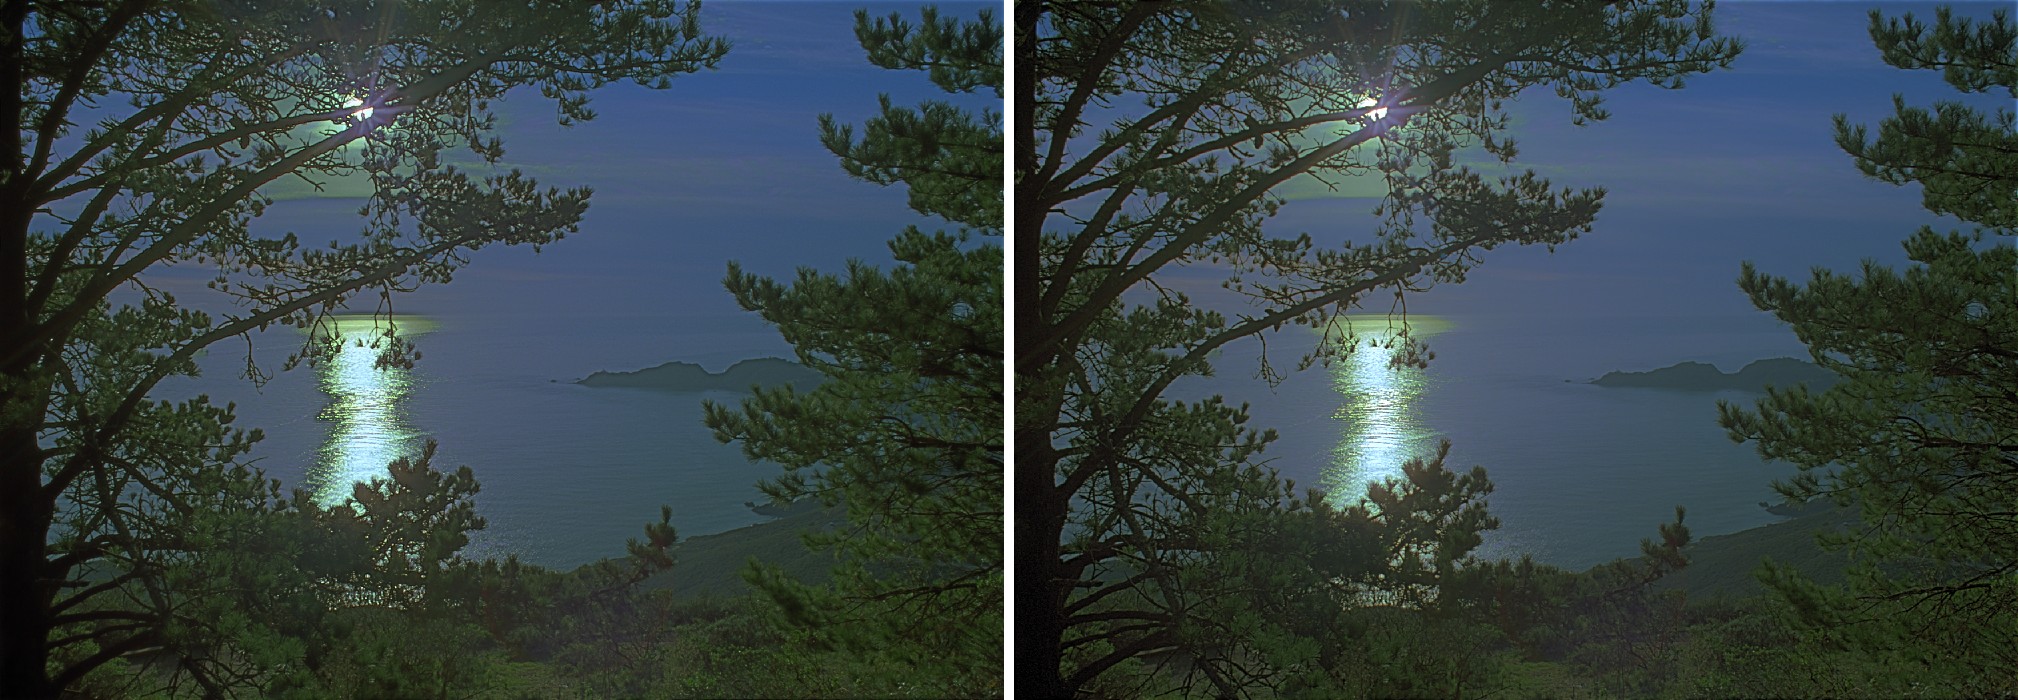
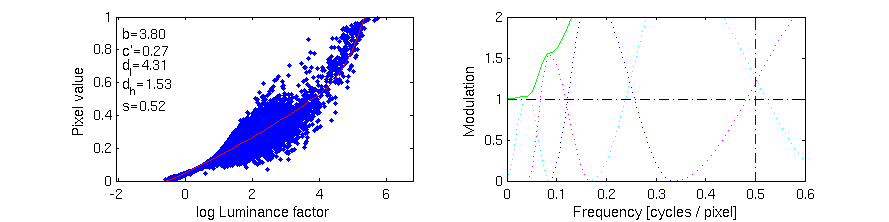
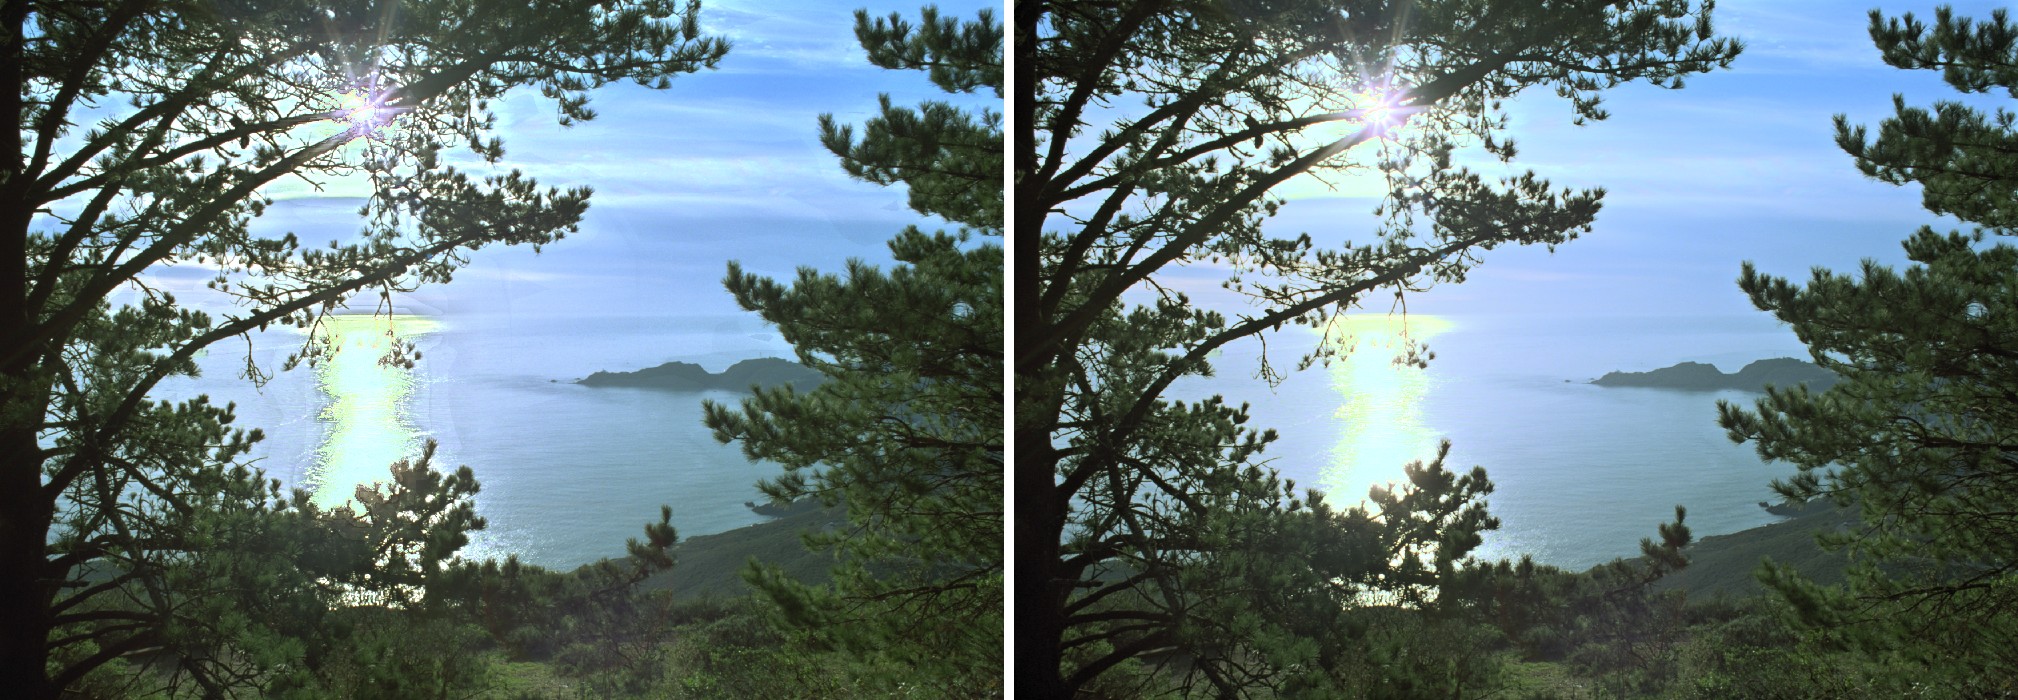
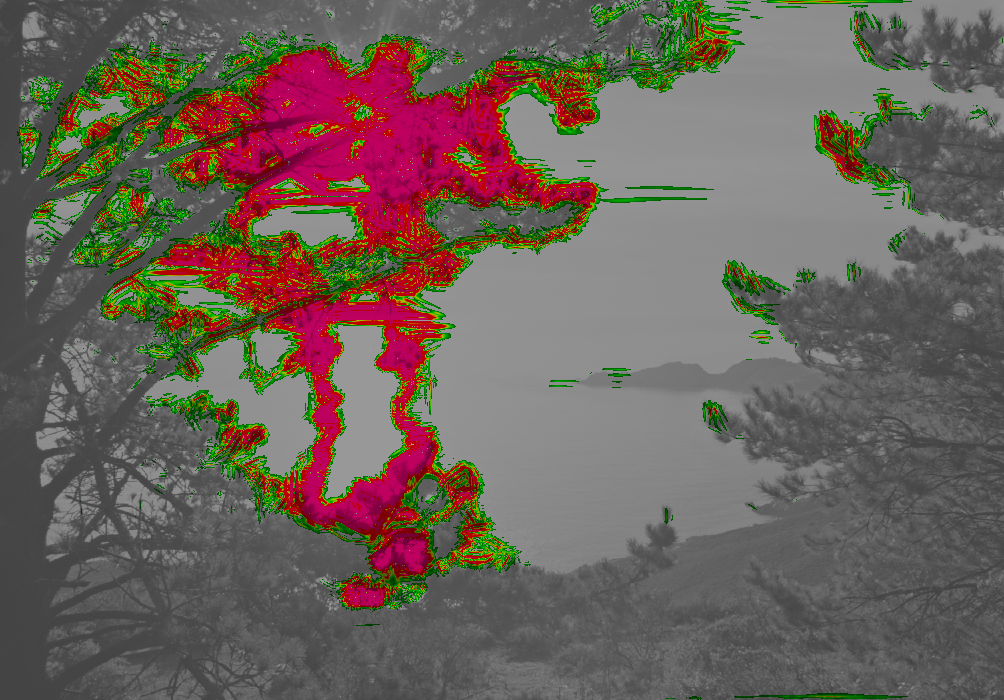
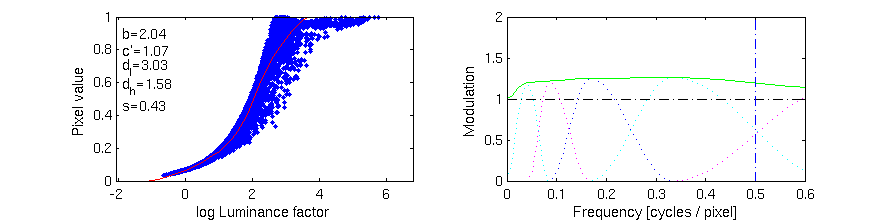
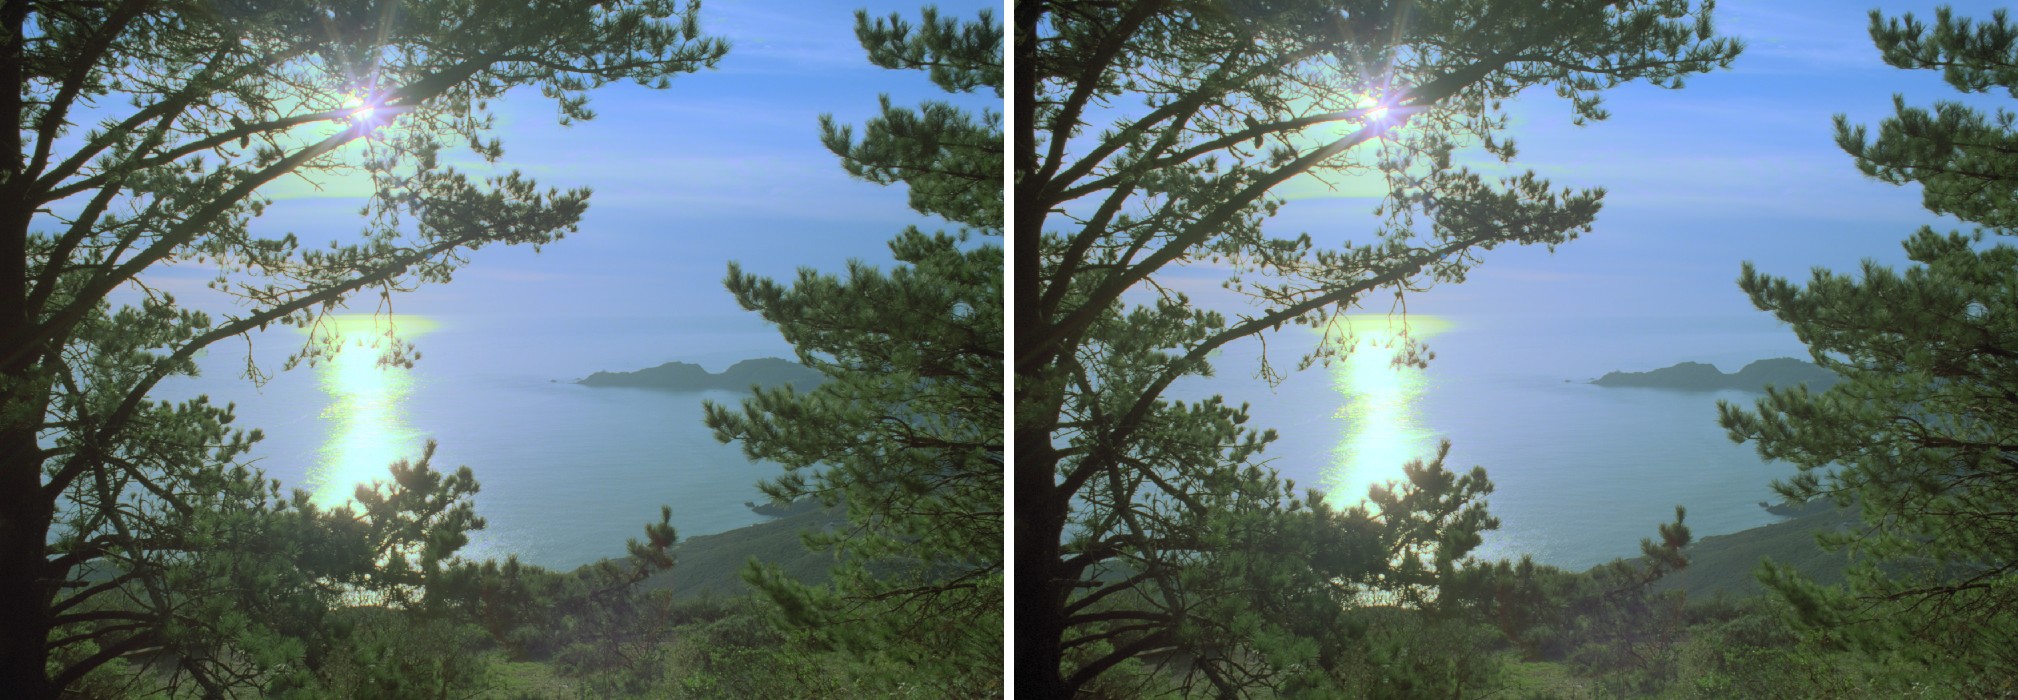
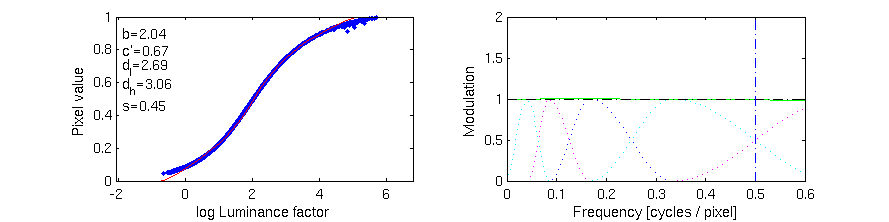
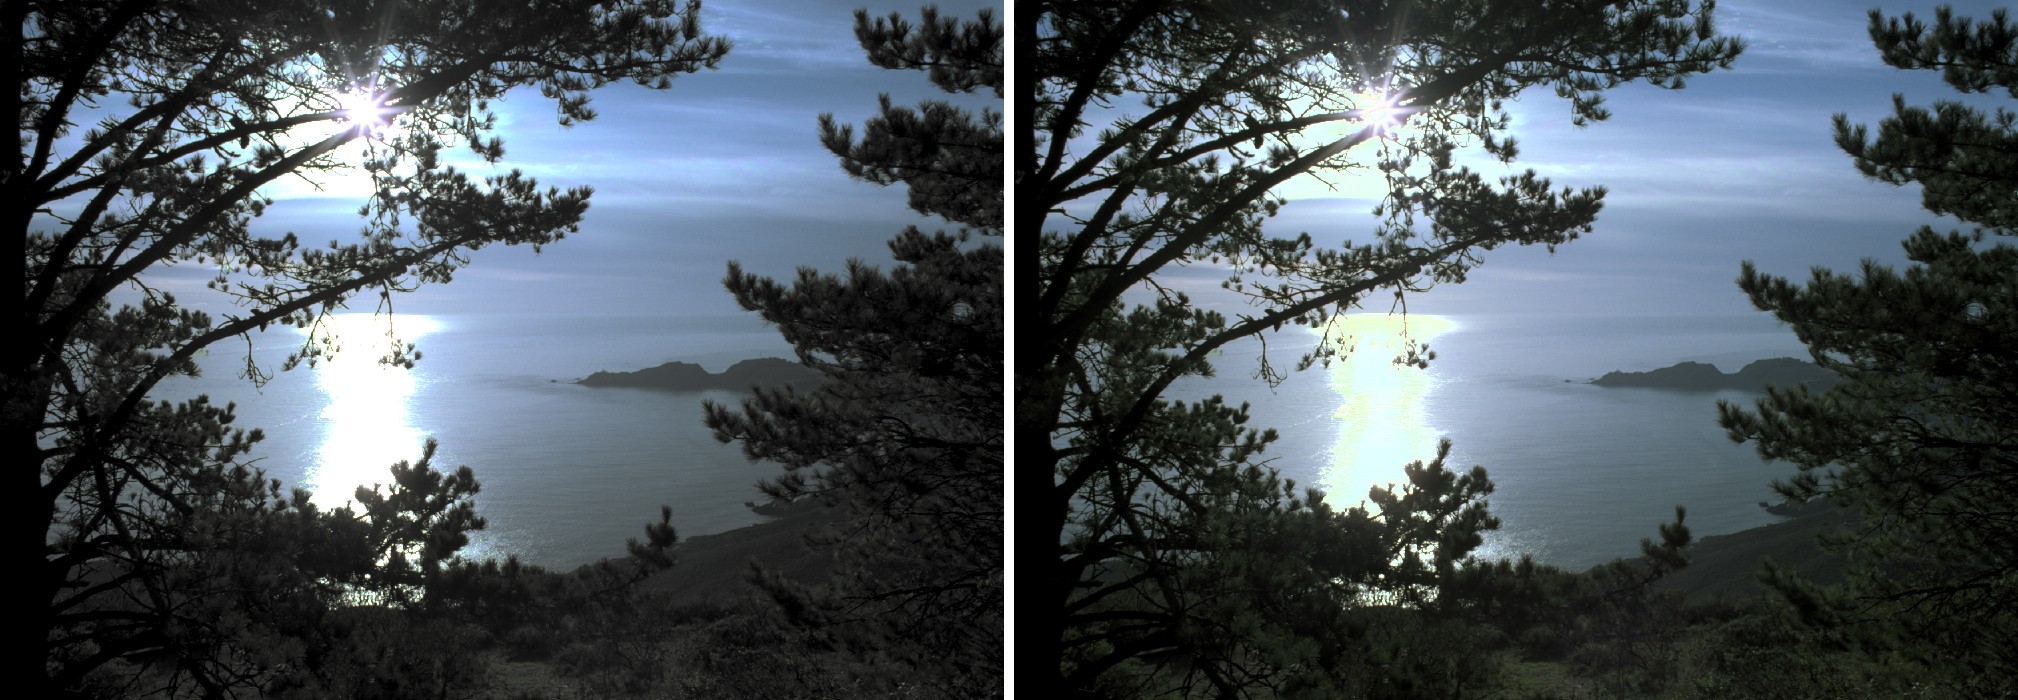
Results of fitting several tone-mapped images to the generic operator. For each row: left the original tone-mapped image (left) and its fit with the generic TMO (right); middle - fitted tone-curve (red) and the scatter plot showing the relation between LDR/HDR luminance values; right - MTF of the fitted generic TMO. The blue vertical line indicates the Nyquist frequency, the black horizontal - the value 1 (no change), and the dotted curves - the base functions of the MTF.
| PSNR=25.59dB | SSIM=0.96 |
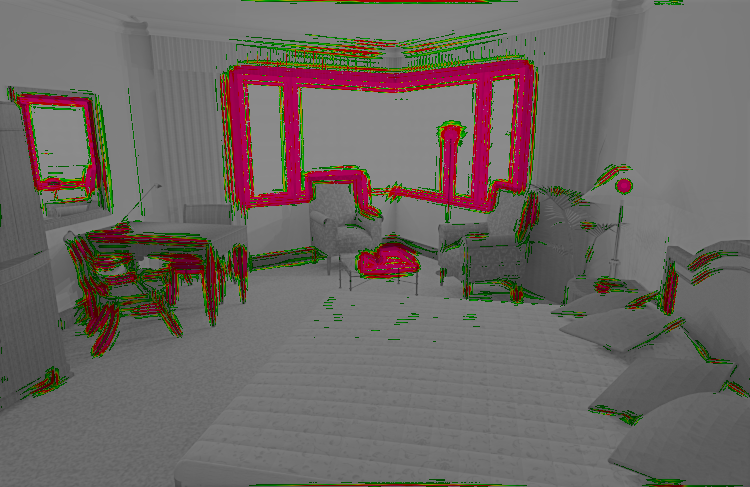
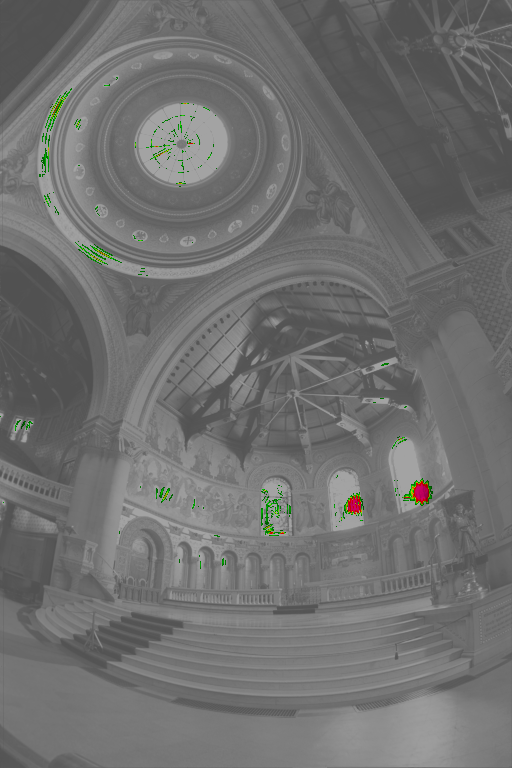
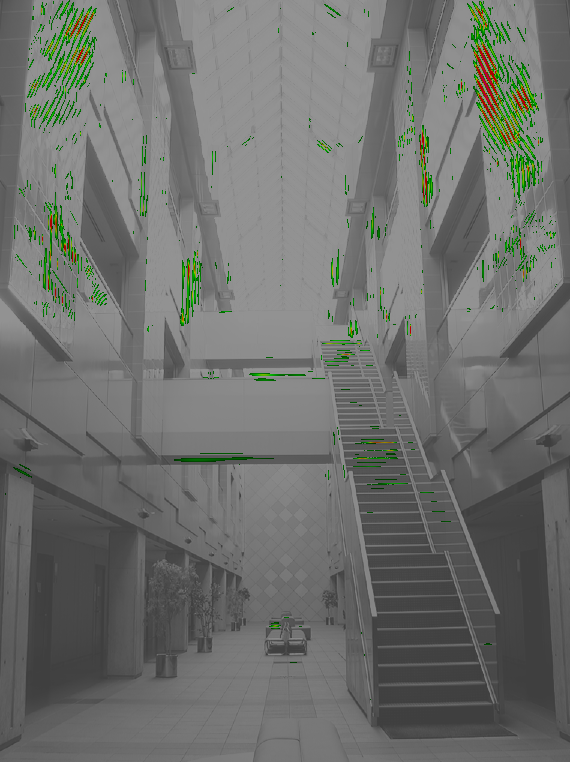
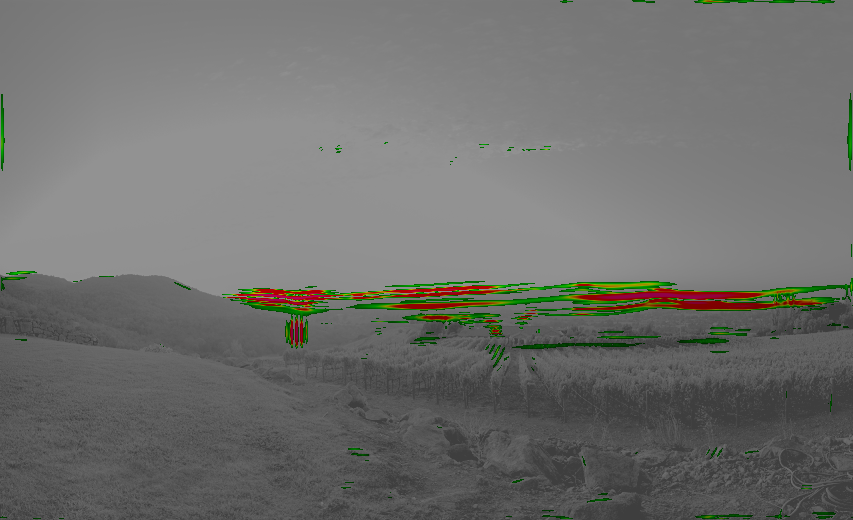
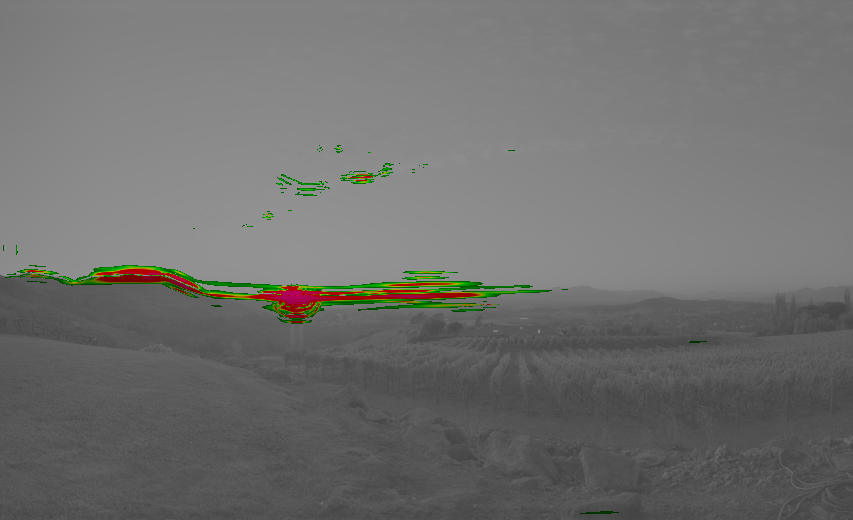
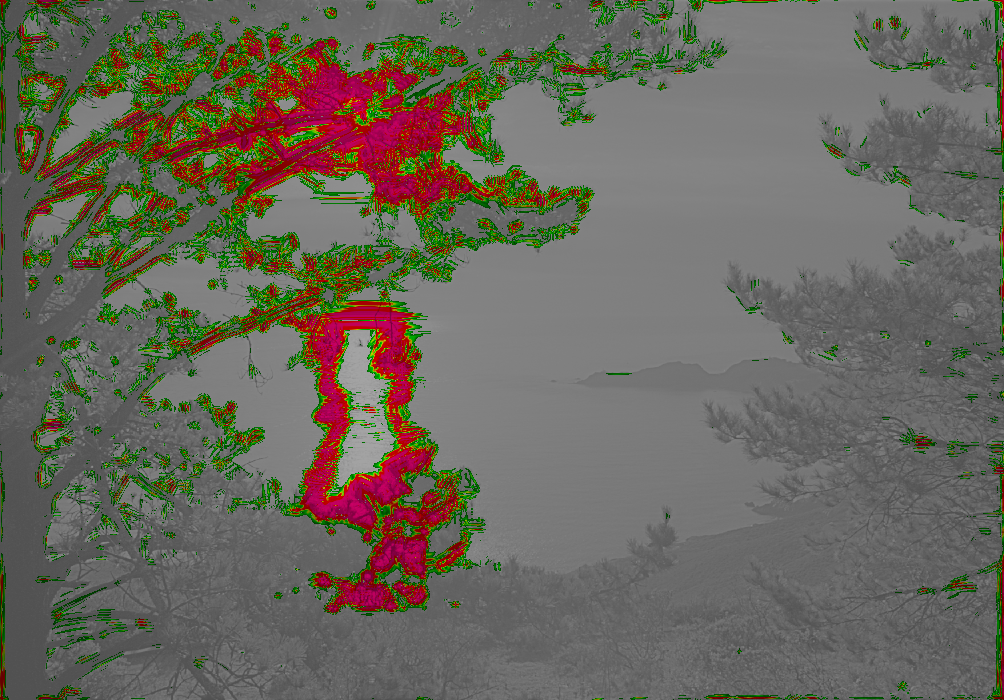
| HDR-VDP75=0.0% | HDR-VDP95=0.0% [map] |
| PSNR=42.94dB | SSIM=0.99 |
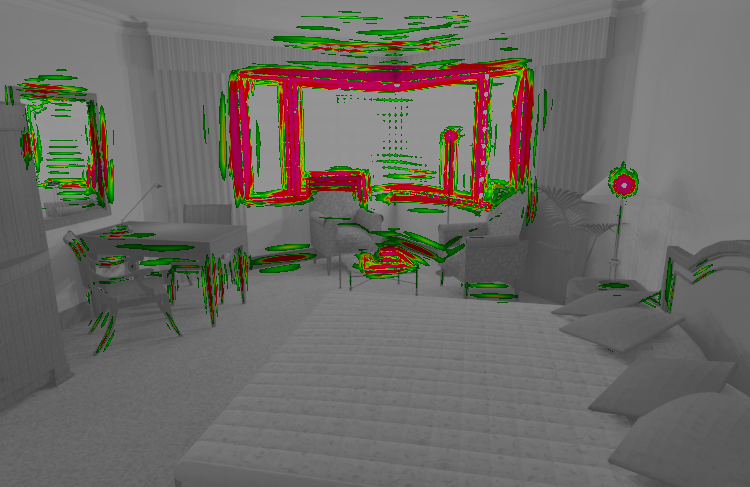
| HDR-VDP75=0.1% | HDR-VDP95=0.0% [map] |
| PSNR=32.40dB | SSIM=0.97 |
| HDR-VDP75=7.5% | HDR-VDP95=5.5% [map] |
| PSNR=36.19dB | SSIM=0.97 |
| HDR-VDP75=4.4% | HDR-VDP95=2.6% [map] |
| PSNR=53.44dB | SSIM=1.00 |
| HDR-VDP75=0.0% | HDR-VDP95=0.0% [map] |
| PSNR=48.58dB | SSIM=1.00 |
| HDR-VDP75=0.0% | HDR-VDP95=0.0% [map] |
| PSNR=28.36dB | SSIM=0.97 |
| HDR-VDP75=0.0% | HDR-VDP95=0.0% [map] |
| PSNR=32.98dB | SSIM=0.98 |
| HDR-VDP75=8.4% | HDR-VDP95=4.2% [map] |
| PSNR=30.82dB | SSIM=0.95 |
| HDR-VDP75=8.2% | HDR-VDP95=5.5% [map] |
| PSNR=34.77dB | SSIM=0.96 |
| HDR-VDP75=8.7% | HDR-VDP95=5.7% [map] |
| PSNR=43.69dB | SSIM=1.00 |
| HDR-VDP75=0.0% | HDR-VDP95=0.0% [map] |
| PSNR=32.29dB | SSIM=1.00 |
| HDR-VDP75=0.1% | HDR-VDP95=0.1% [map] |
| PSNR=30.41dB | SSIM=0.92 |
| HDR-VDP75=0.2% | HDR-VDP95=0.0% [map] |
| PSNR=27.41dB | SSIM=0.93 |
| HDR-VDP75=1.6% | HDR-VDP95=0.5% [map] |
| PSNR=25.13dB | SSIM=0.92 |
| HDR-VDP75=39.1% | HDR-VDP95=26.7% [map] |
| PSNR=31.28dB | SSIM=0.92 |
| HDR-VDP75=21.9% | HDR-VDP95=11.8% [map] |
| PSNR=54.81dB | SSIM=1.00 |
| HDR-VDP75=0.0% | HDR-VDP95=0.0% [map] |
| PSNR=44.23dB | SSIM=1.00 |
| HDR-VDP75=0.0% | HDR-VDP95=0.0% [map] |
| PSNR=32.10dB | SSIM=0.97 |
| HDR-VDP75=0.0% | HDR-VDP95=0.0% [map] |
| PSNR=21.05dB | SSIM=0.95 |
| HDR-VDP75=2.4% | HDR-VDP95=1.2% [map] |
| PSNR=34.07dB | SSIM=0.95 |
| HDR-VDP75=4.0% | HDR-VDP95=2.3% [map] |
| PSNR=36.80dB | SSIM=0.97 |
| HDR-VDP75=4.0% | HDR-VDP95=2.8% [map] |
| PSNR=47.80dB | SSIM=1.00 |
| HDR-VDP75=0.0% | HDR-VDP95=0.0% [map] |
| PSNR=45.27dB | SSIM=1.00 |
| HDR-VDP75=0.0% | HDR-VDP95=0.0% [map] |
| PSNR=28.20dB | SSIM=0.97 |
| HDR-VDP75=0.9% | HDR-VDP95=0.3% [map] |
| PSNR=37.80dB | SSIM=0.99 |
| HDR-VDP75=0.3% | HDR-VDP95=0.1% [map] |
| PSNR=37.80dB | SSIM=0.98 |
| HDR-VDP75=1.1% | HDR-VDP95=0.6% [map] |
| PSNR=39.24dB | SSIM=0.98 |
| HDR-VDP75=0.6% | HDR-VDP95=0.2% [map] |
| PSNR=46.96dB | SSIM=1.00 |
| HDR-VDP75=0.0% | HDR-VDP95=0.0% [map] |
| PSNR=39.20dB | SSIM=1.00 |
| HDR-VDP75=0.0% | HDR-VDP95=0.0% [map] |
| PSNR=26.68dB | SSIM=0.94 |
| HDR-VDP75=0.3% | HDR-VDP95=0.0% [map] |
| PSNR=35.50dB | SSIM=0.98 |
| HDR-VDP75=8.1% | HDR-VDP95=3.9% [map] |

| PSNR=28.01dB | SSIM=0.92 |
| HDR-VDP75=27.2% | HDR-VDP95=20.0% [map] |

| PSNR=33.59dB | SSIM=0.92 |
| HDR-VDP75=21.8% | HDR-VDP95=15.0% [map] |
| PSNR=36.95dB | SSIM=1.00 |
| HDR-VDP75=0.0% | HDR-VDP95=0.0% [map] |
| PSNR=26.19dB | SSIM=0.93 |
| HDR-VDP75=25.1% | HDR-VDP95=17.9% [map] |
| PSNR=23.98dB | SSIM=0.90 |
| HDR-VDP75=3.7% | HDR-VDP95=0.5% [map] |
| PSNR=29.84dB | SSIM=0.95 |
| HDR-VDP75=4.9% | HDR-VDP95=1.9% [map] |
| PSNR=32.31dB | SSIM=0.97 |
| HDR-VDP75=7.2% | HDR-VDP95=3.8% [map] |
| PSNR=33.55dB | SSIM=0.94 |
| HDR-VDP75=11.1% | HDR-VDP95=7.1% [map] |
| PSNR=44.27dB | SSIM=1.00 |
| HDR-VDP75=0.0% | HDR-VDP95=0.0% [map] |
| PSNR=34.08dB | SSIM=0.99 |
| HDR-VDP75=0.0% | HDR-VDP95=0.0% [map] |