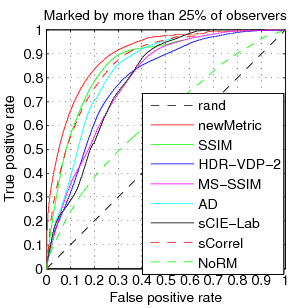
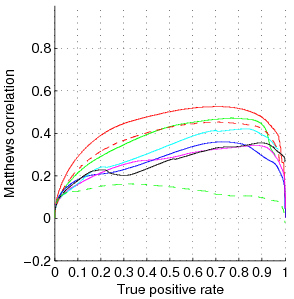
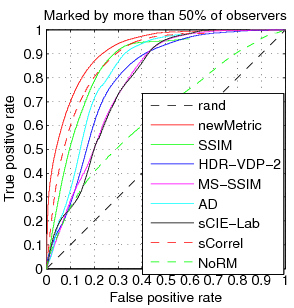
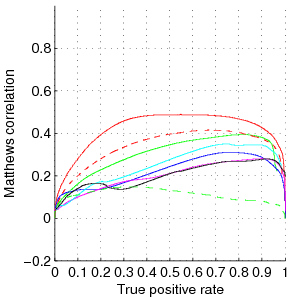
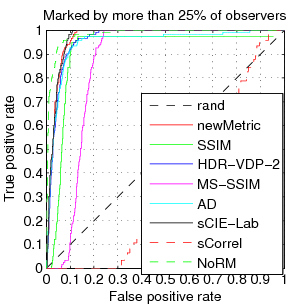
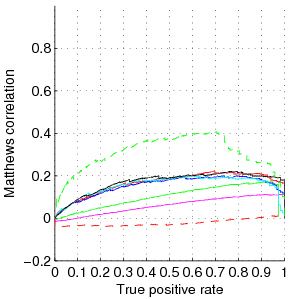
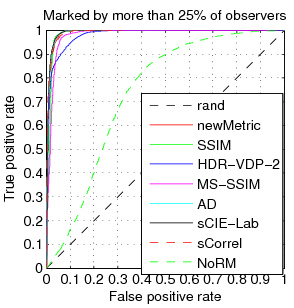
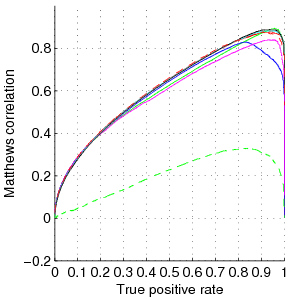
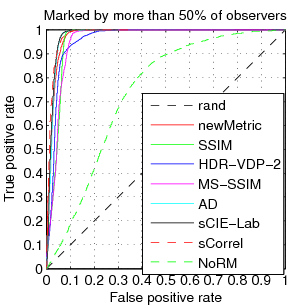
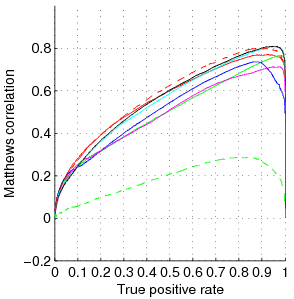
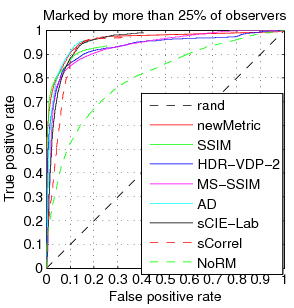
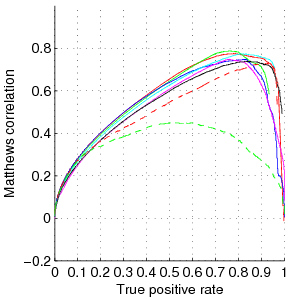
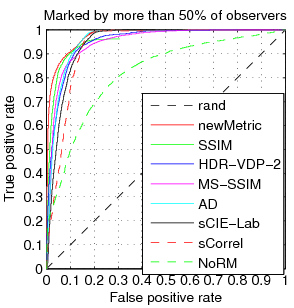
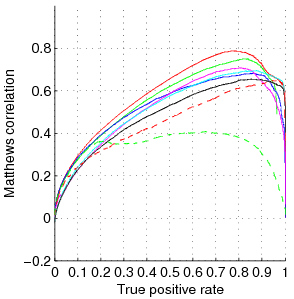
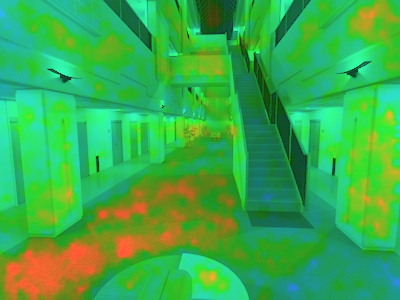
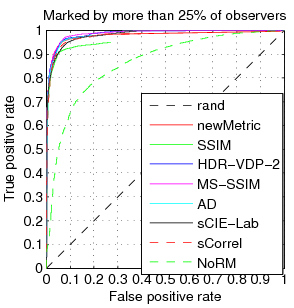
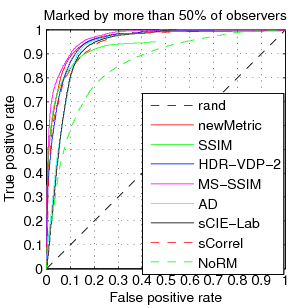
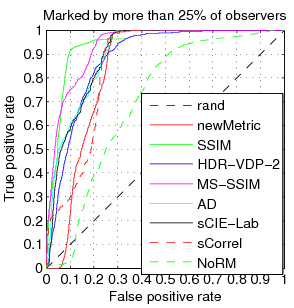
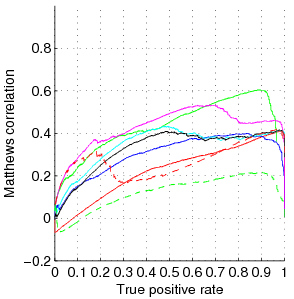
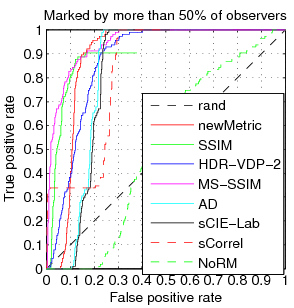
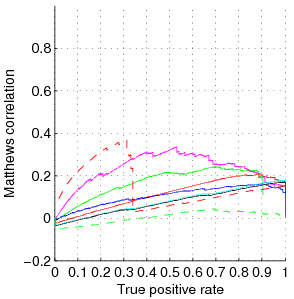
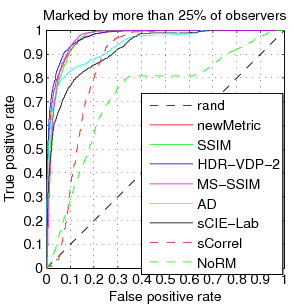
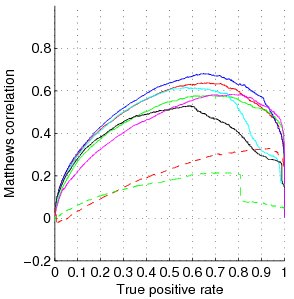
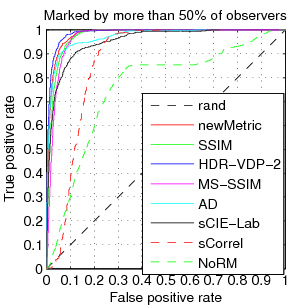
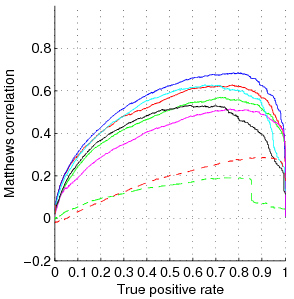
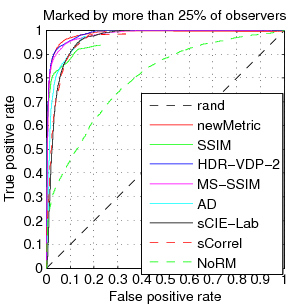
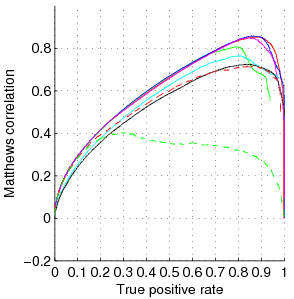
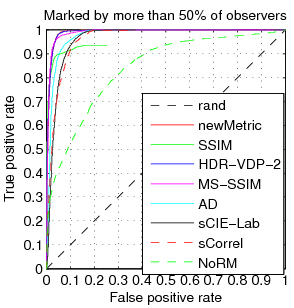
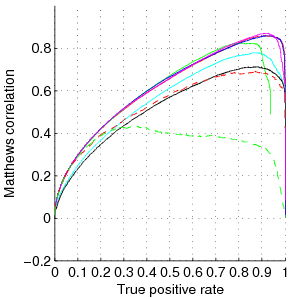
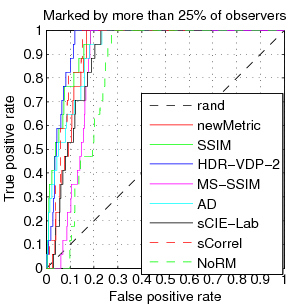
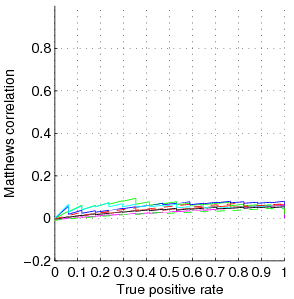
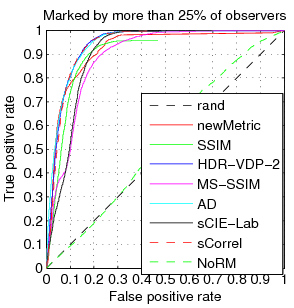
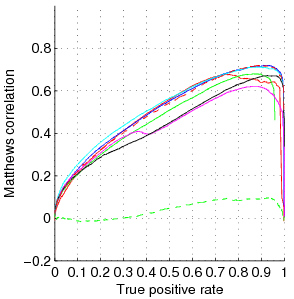
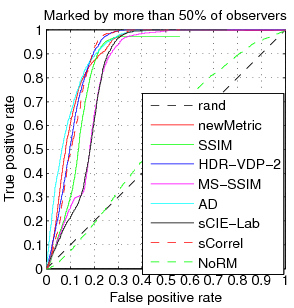
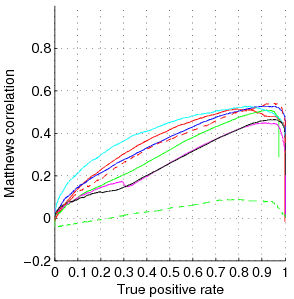
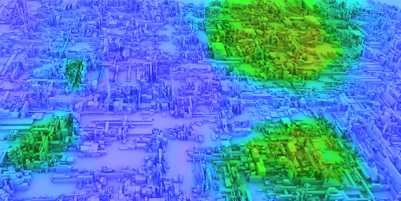
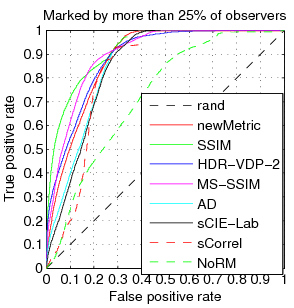
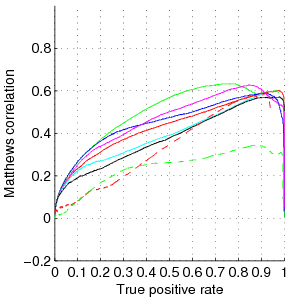
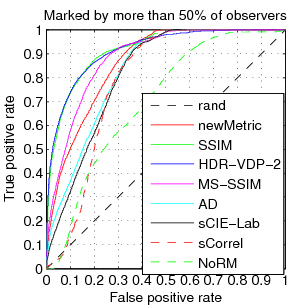
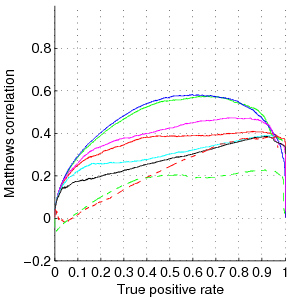
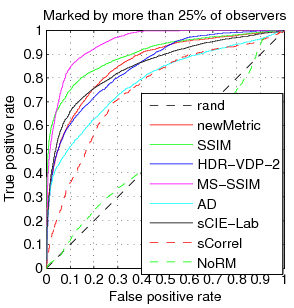
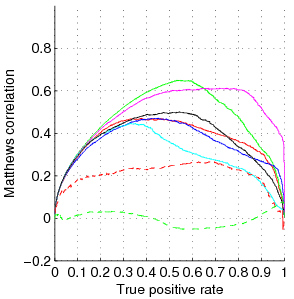
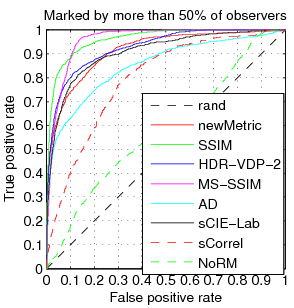
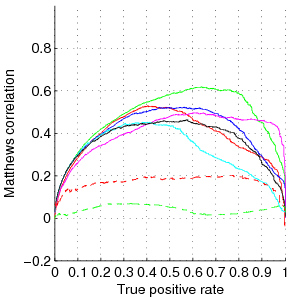
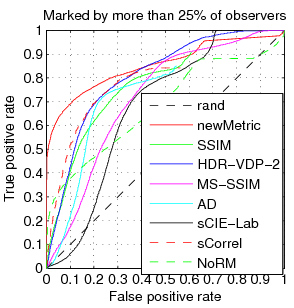
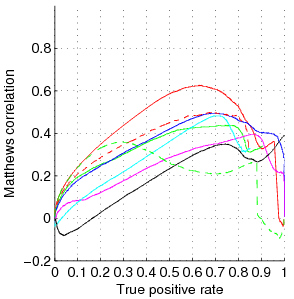
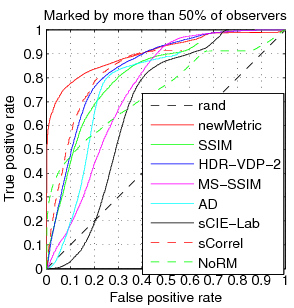
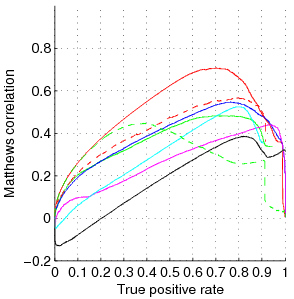
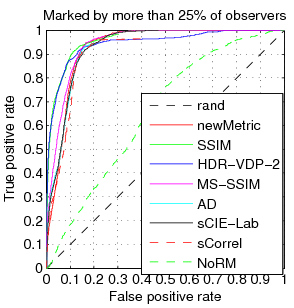
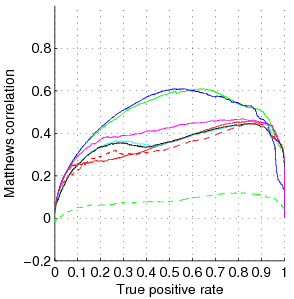
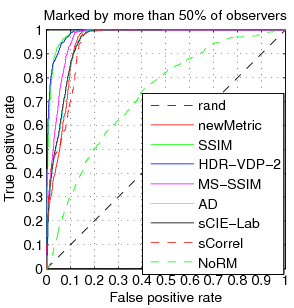
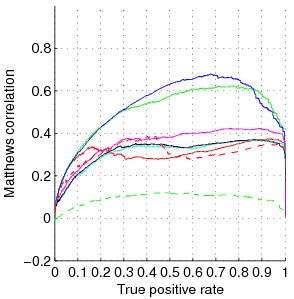
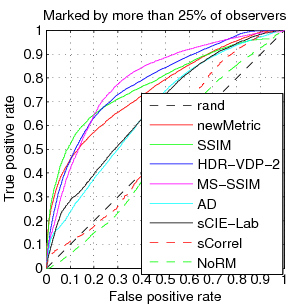
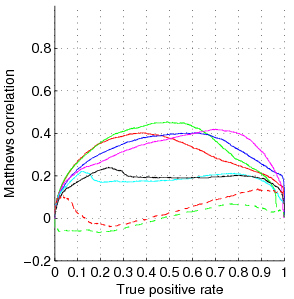
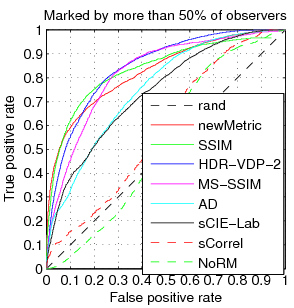
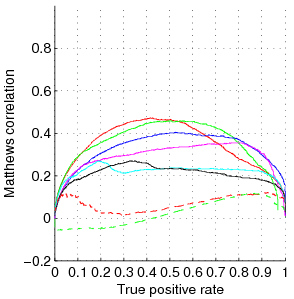
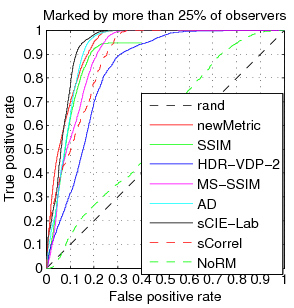
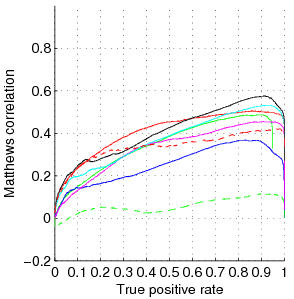
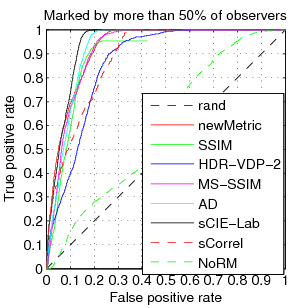
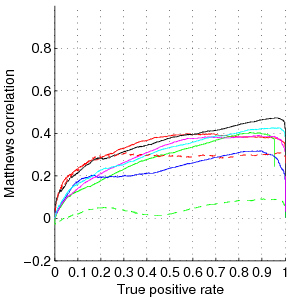
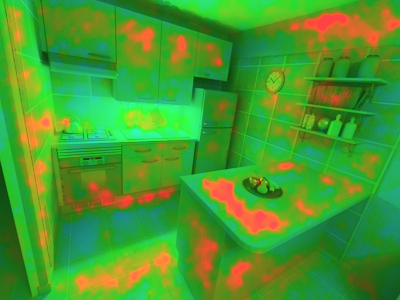
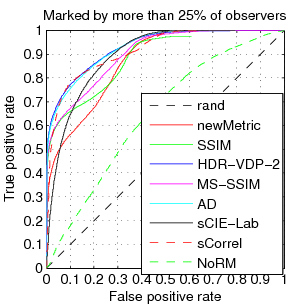
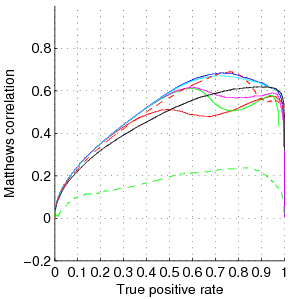
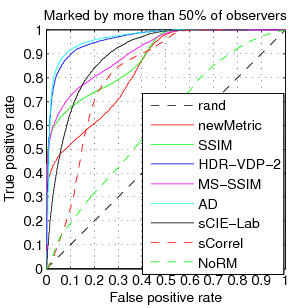
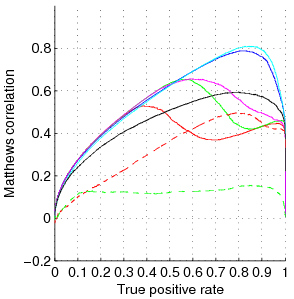
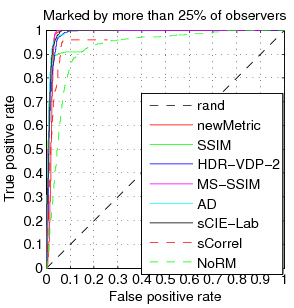
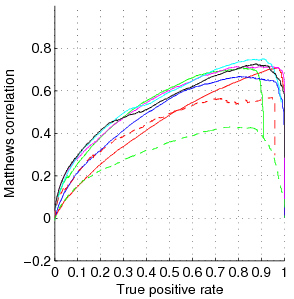
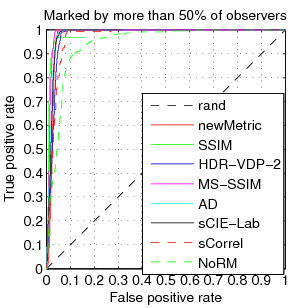
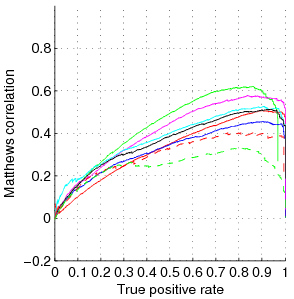
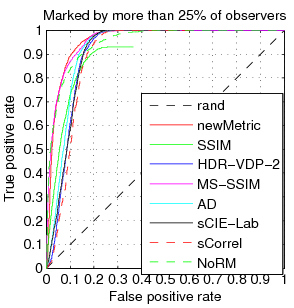
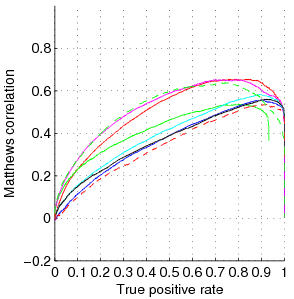
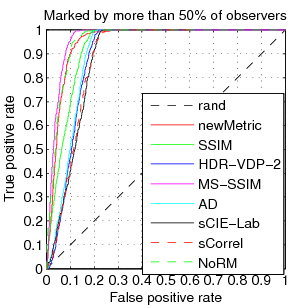
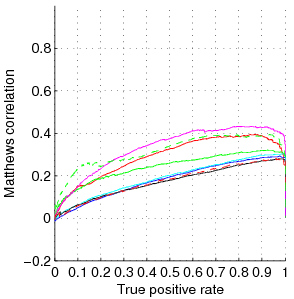
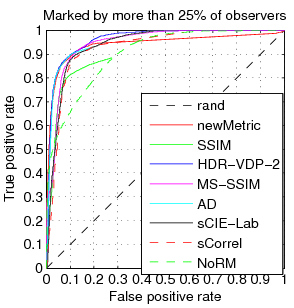
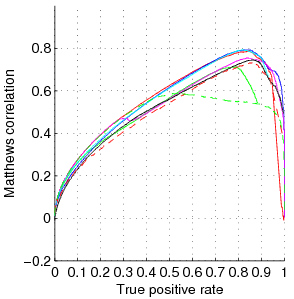
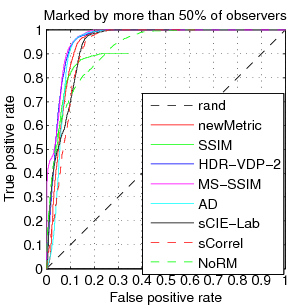
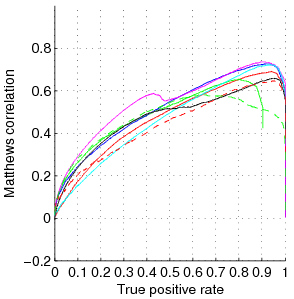
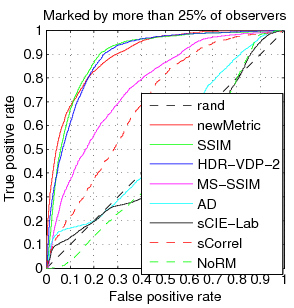
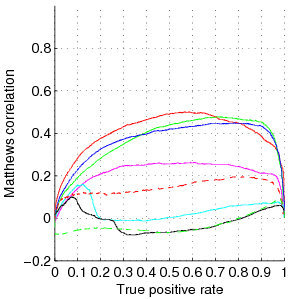
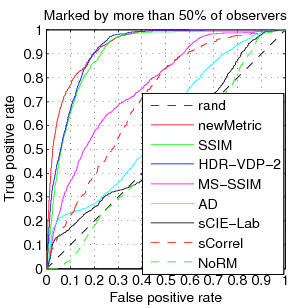
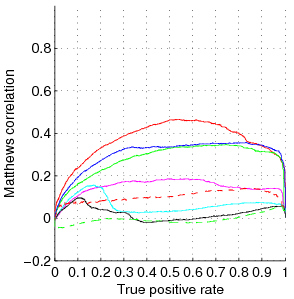
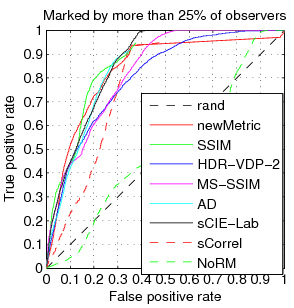
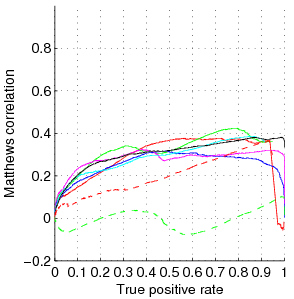
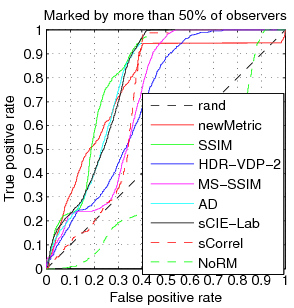
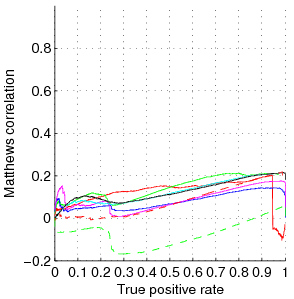
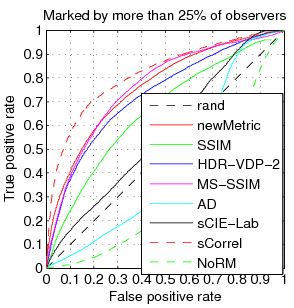
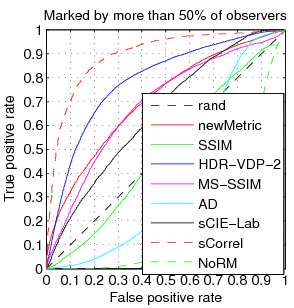
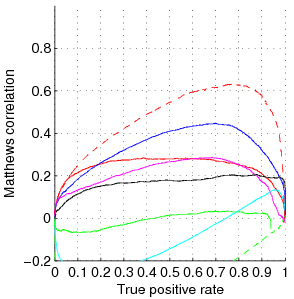
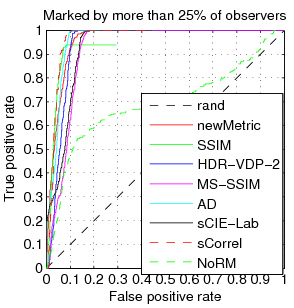
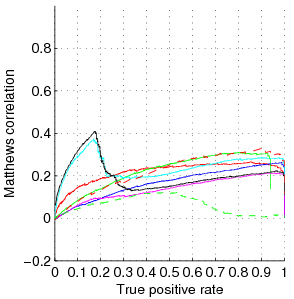
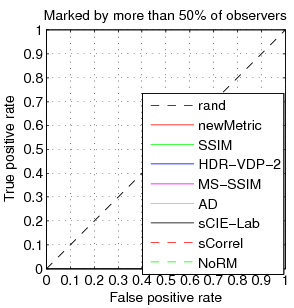
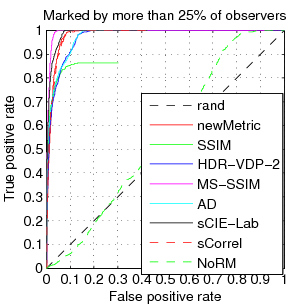
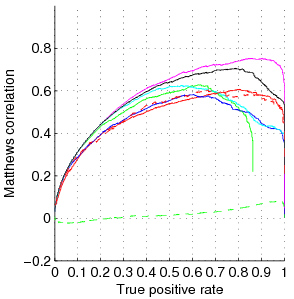
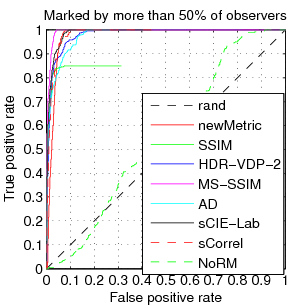
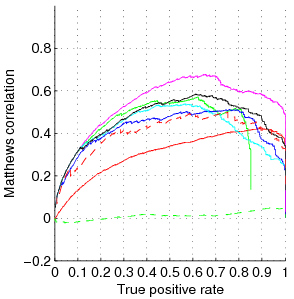
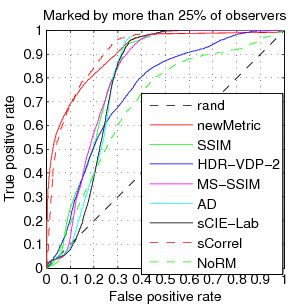
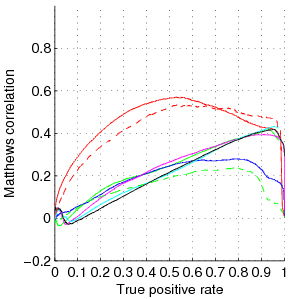
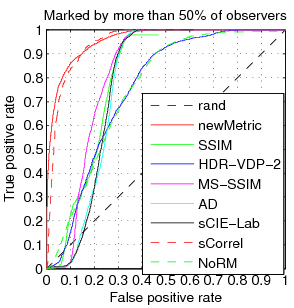
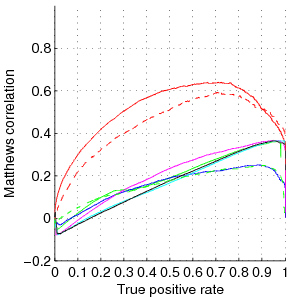
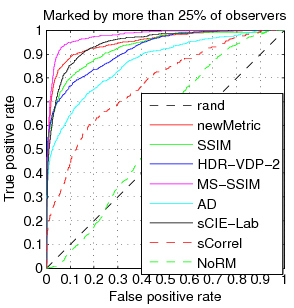
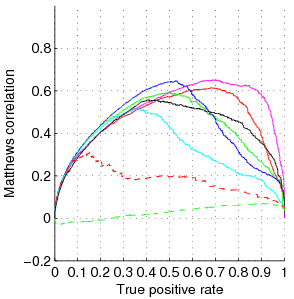
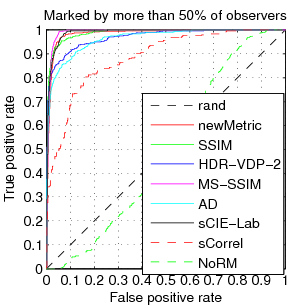
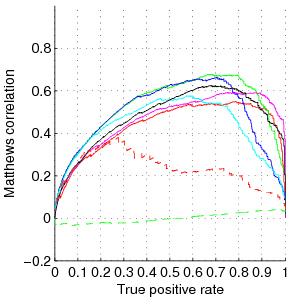
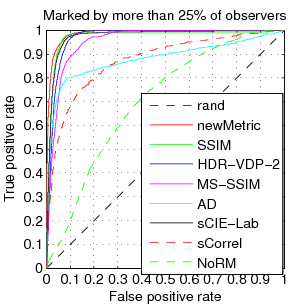
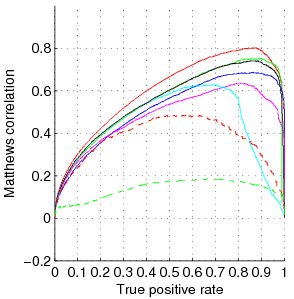
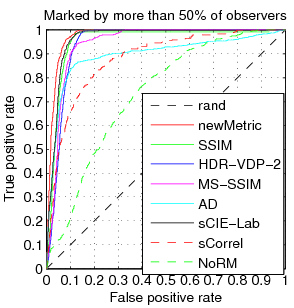
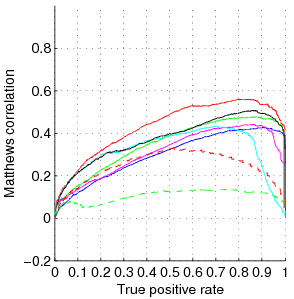
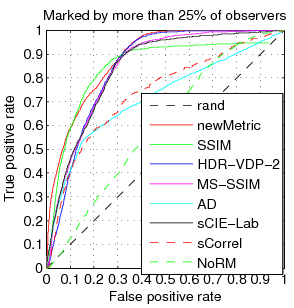
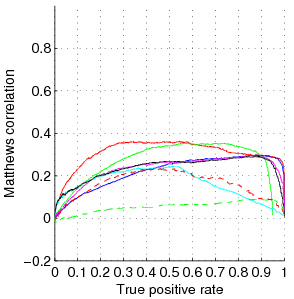
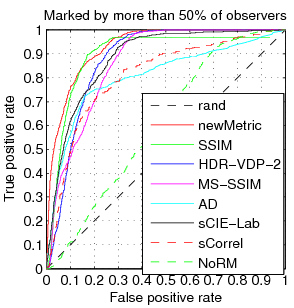
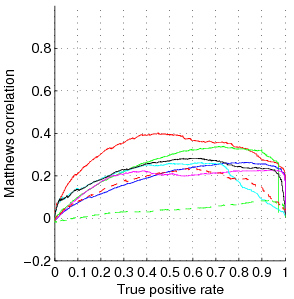
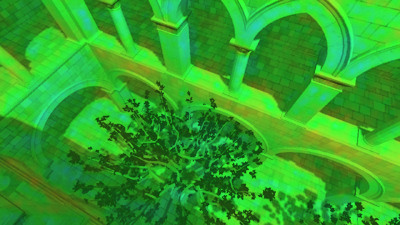
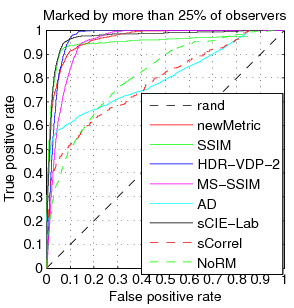
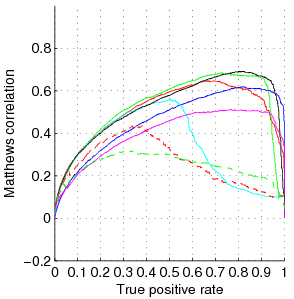
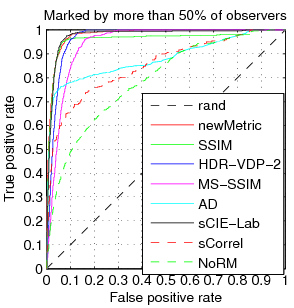
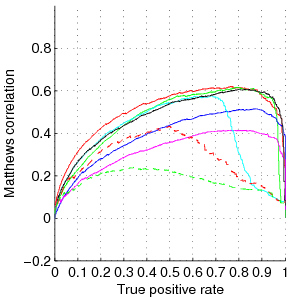
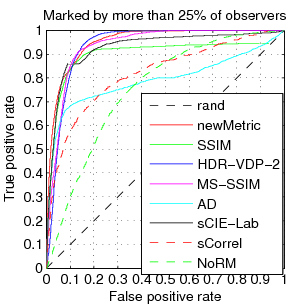
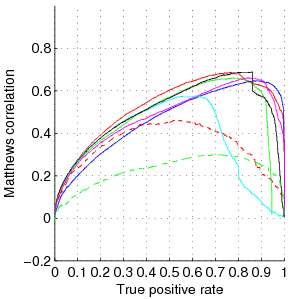
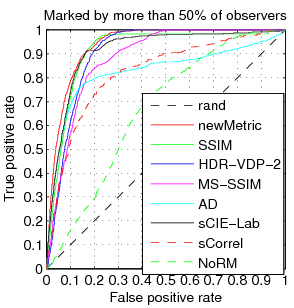
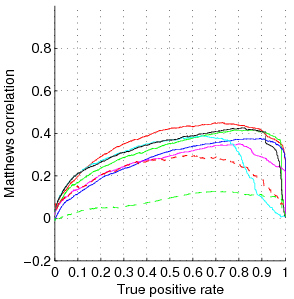
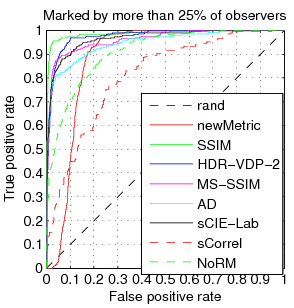
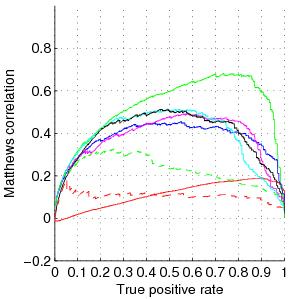
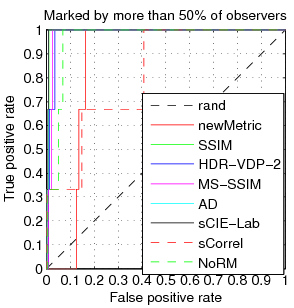
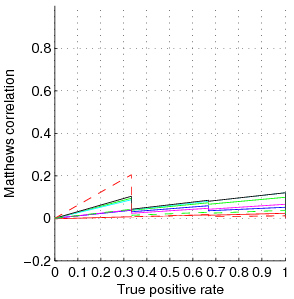
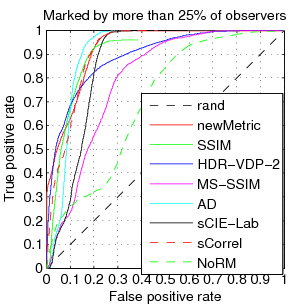
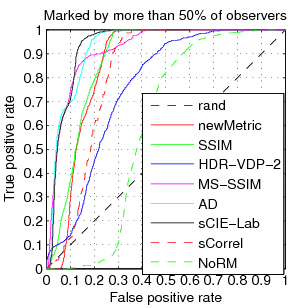
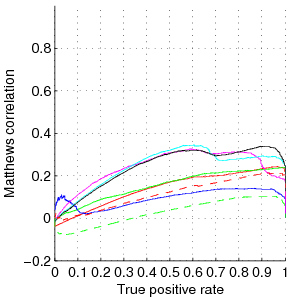
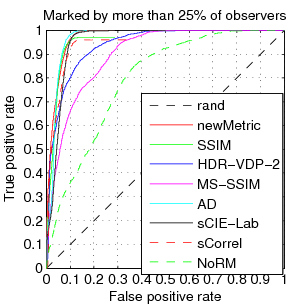
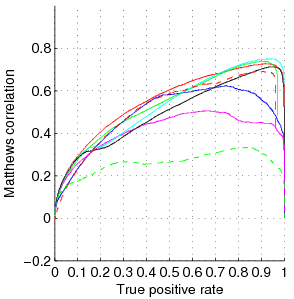
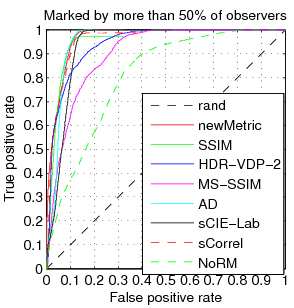
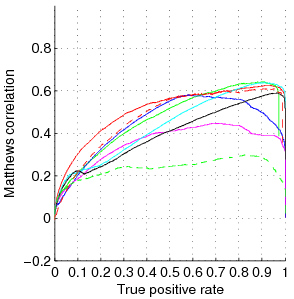
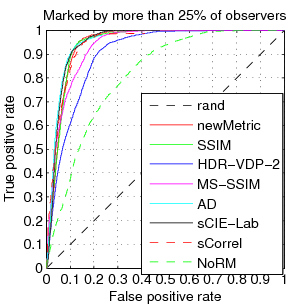
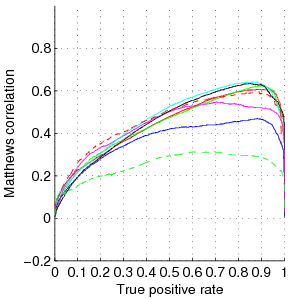
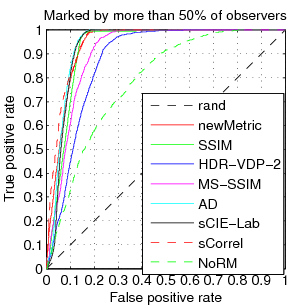
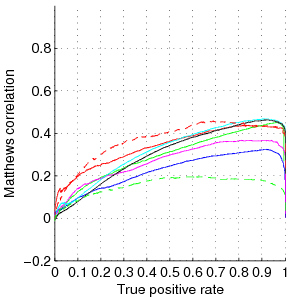
The plots below illustrate the performance of the metrics for all scenes analyzed together and for each scene separately.
auc@25, auc@50 is the area under the ROC assuming that more than
25% or 50% of observers mark the region.
rho is Spearman's non-parametric coefficient of correlation. The correlation is computed only for the regions that were selected by more than 5% and less than 95% of observers.
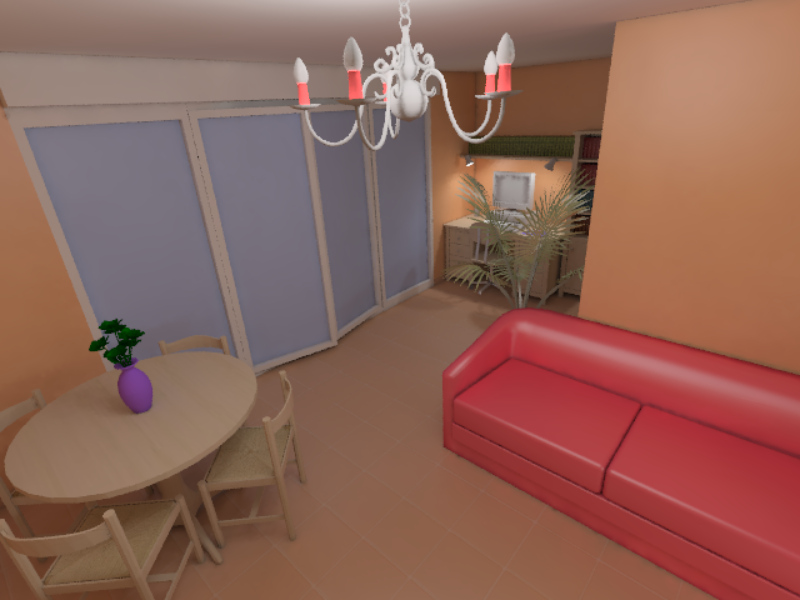
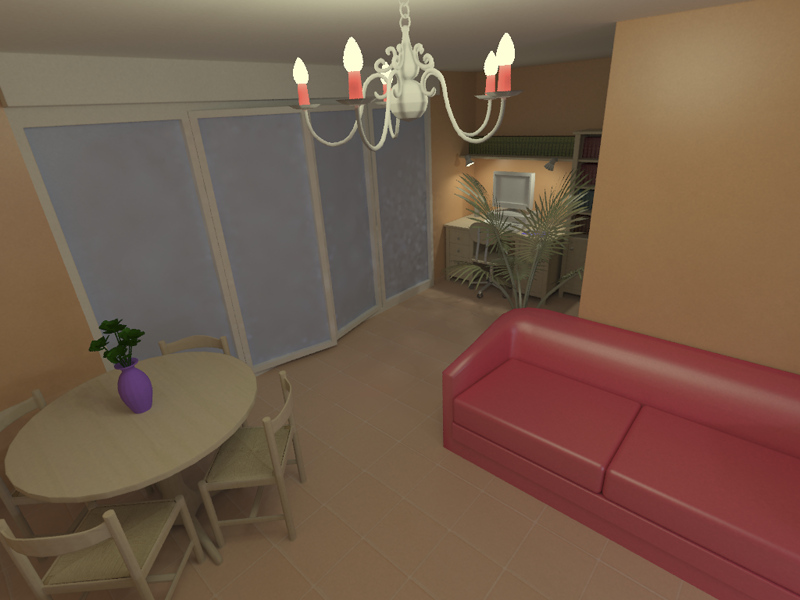
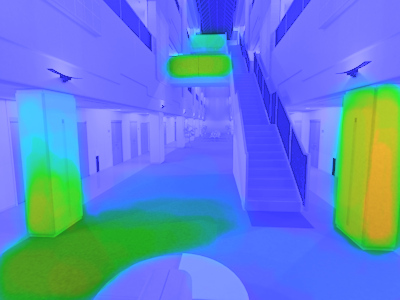
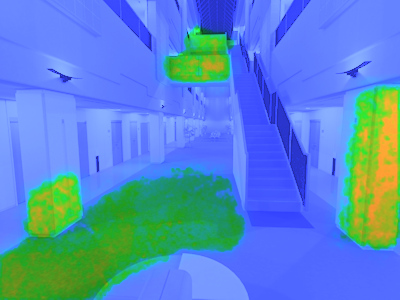
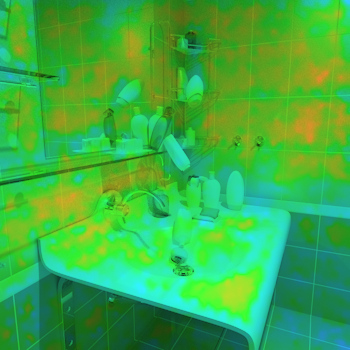
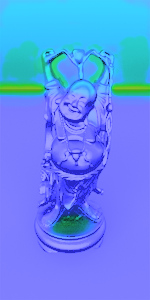
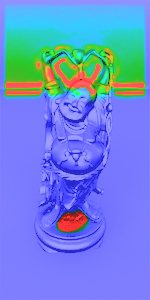
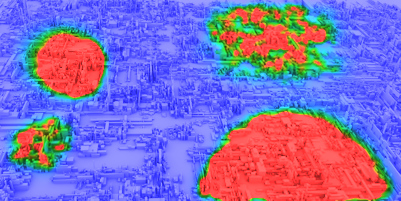
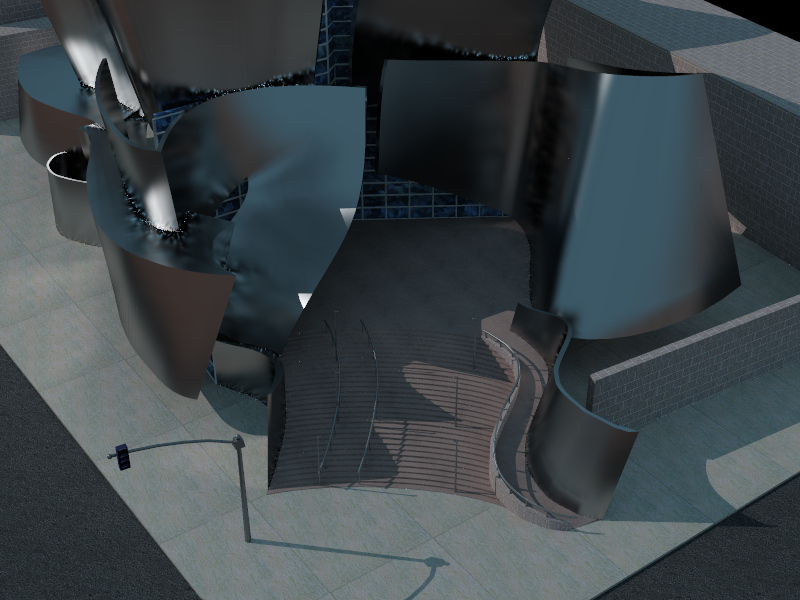
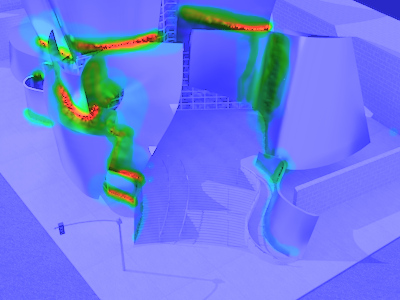
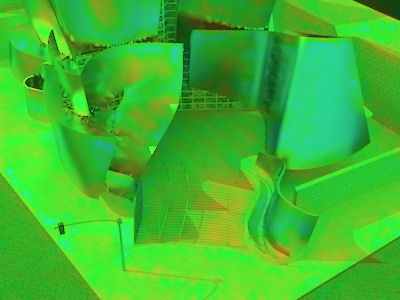
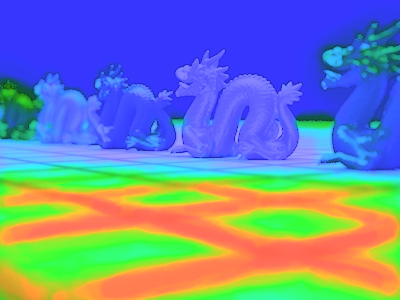
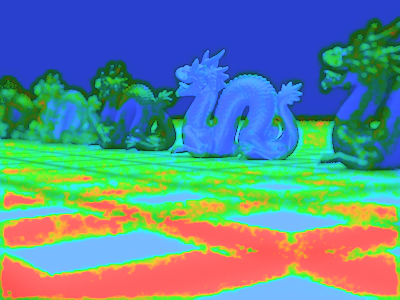
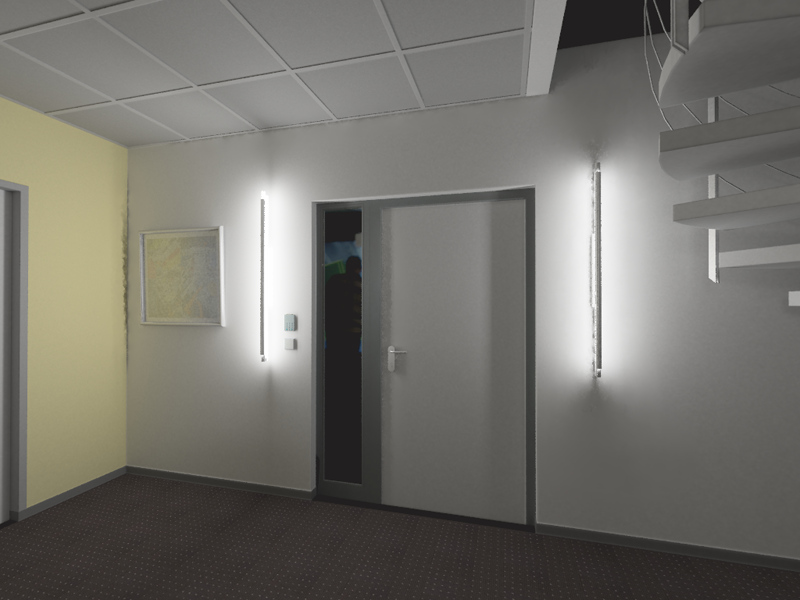
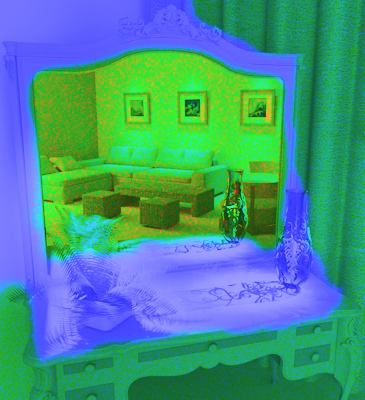
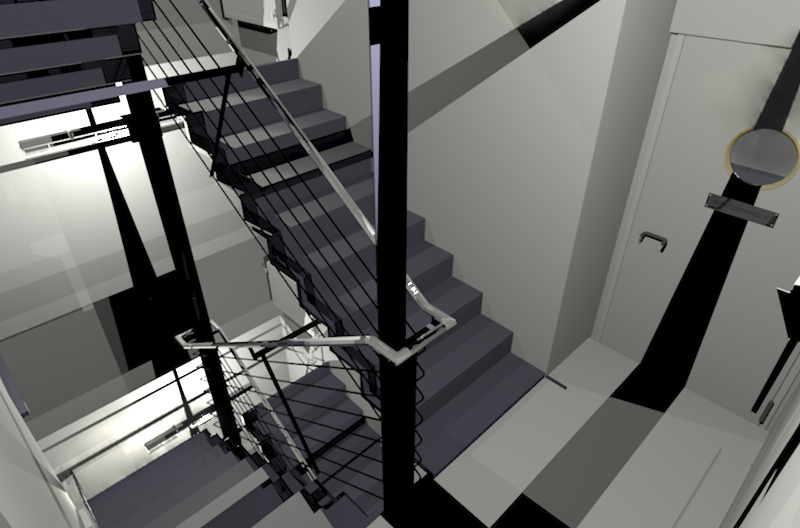
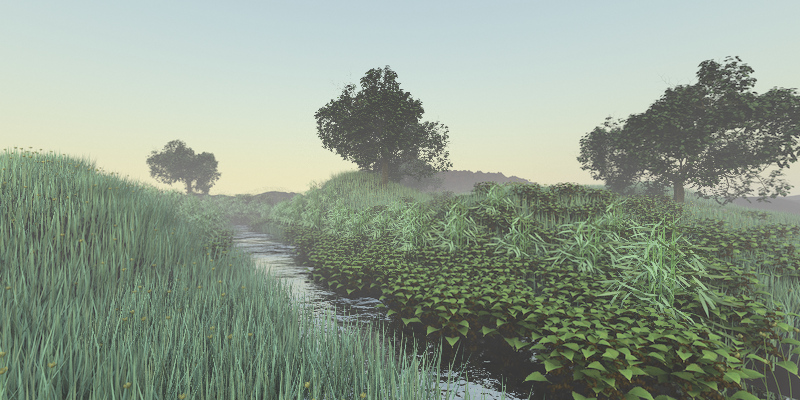
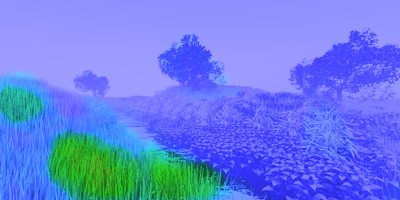
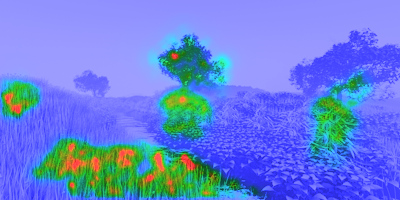
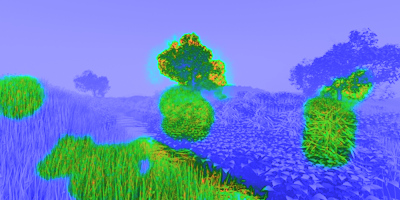
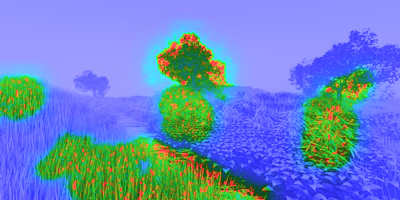
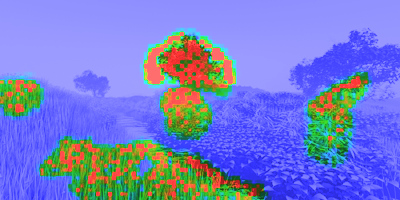
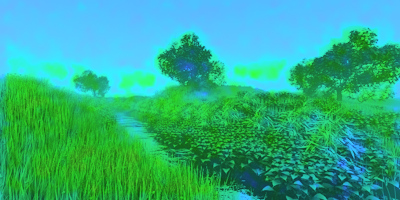
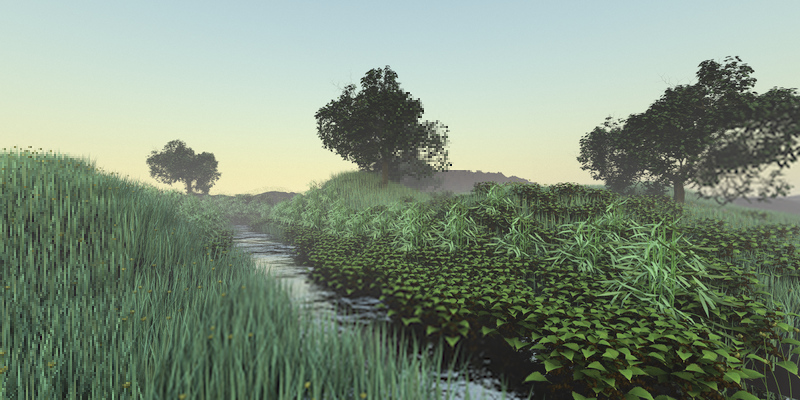
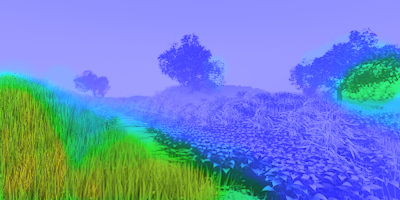
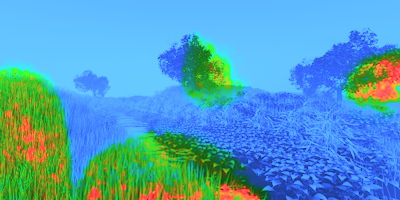
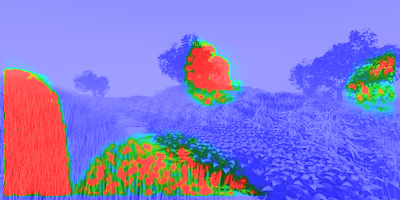
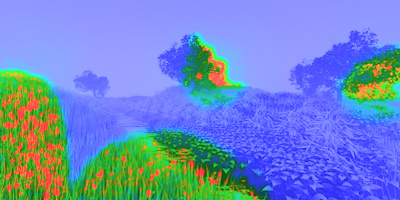
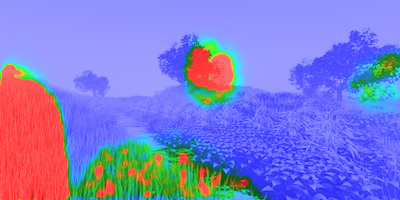
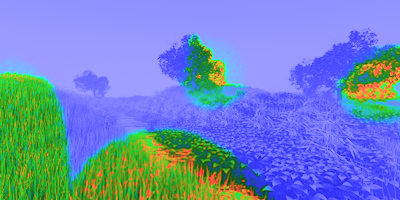
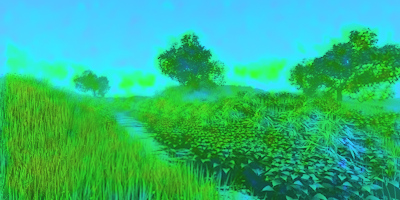
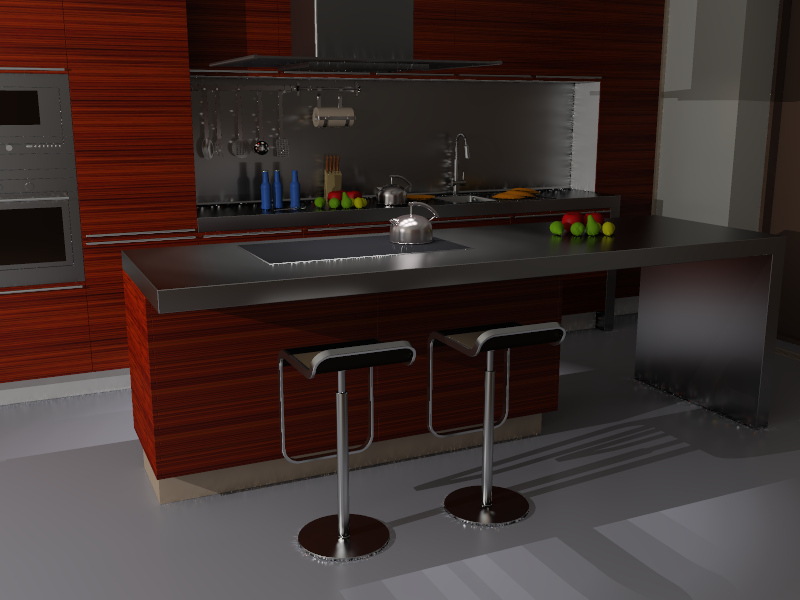
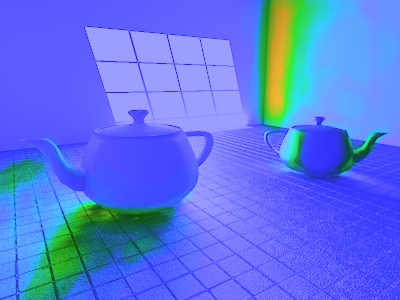
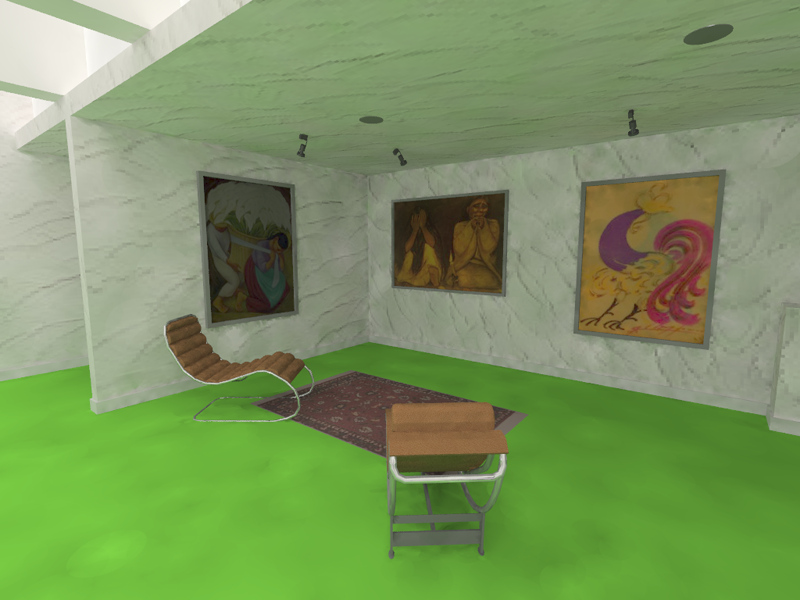
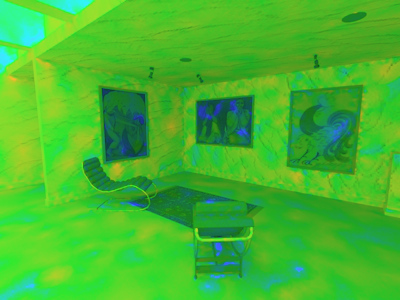
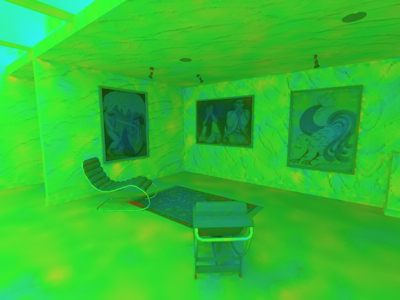
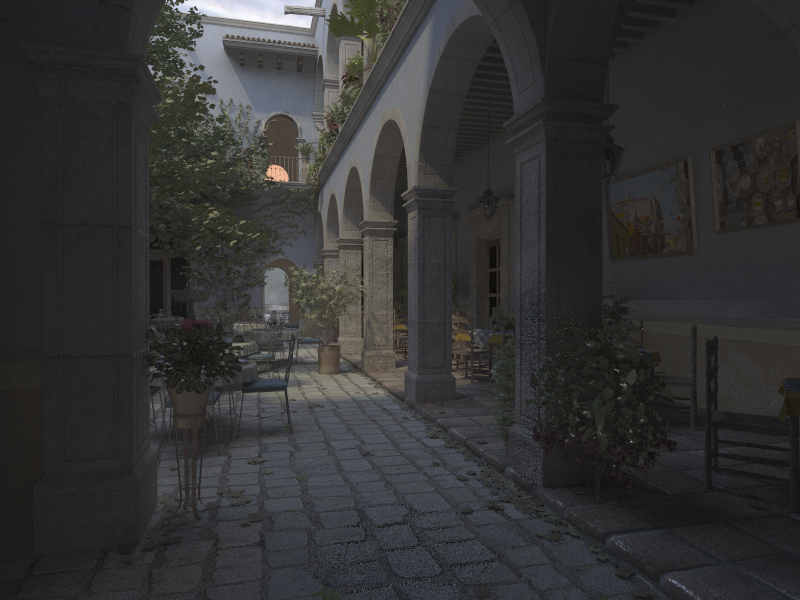
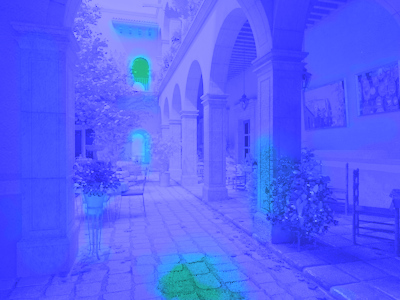
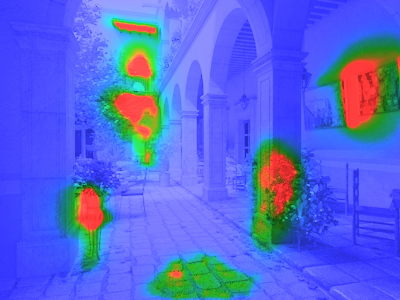
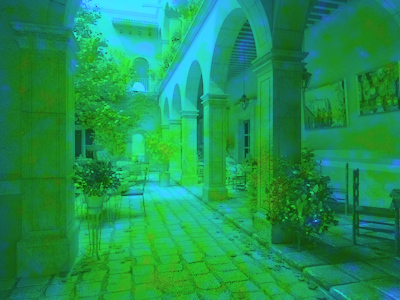
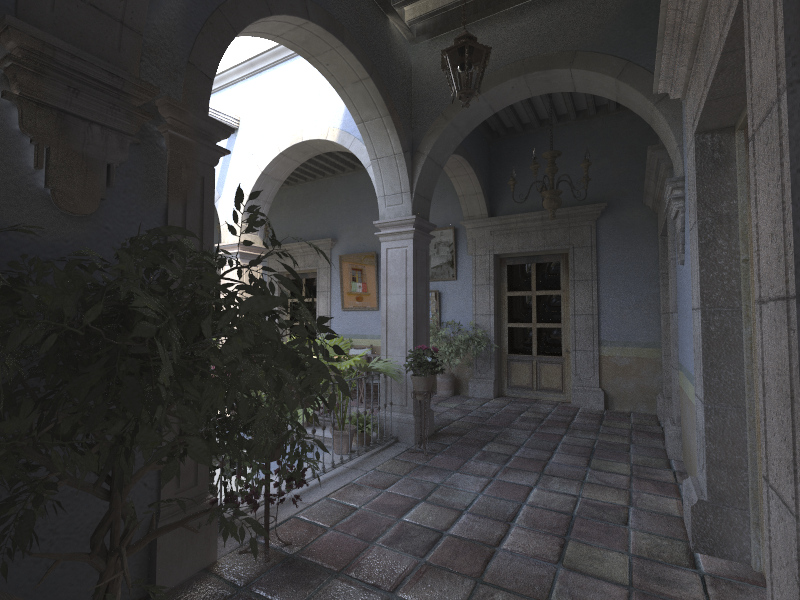
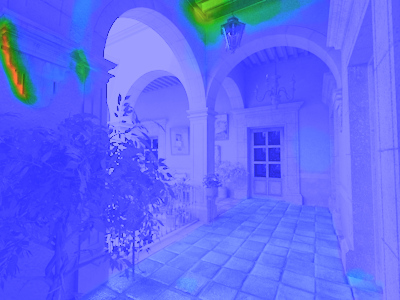
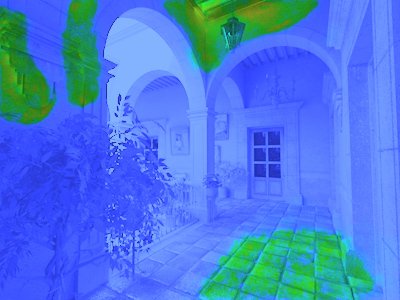
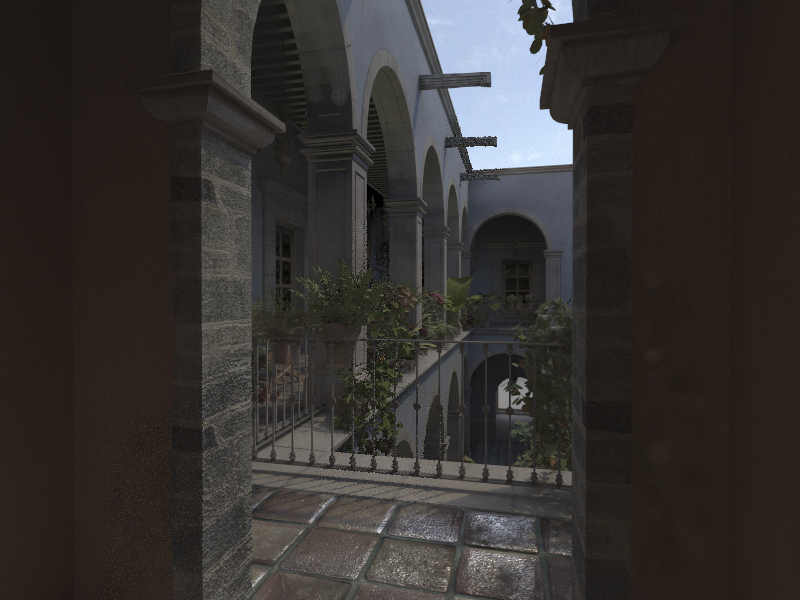
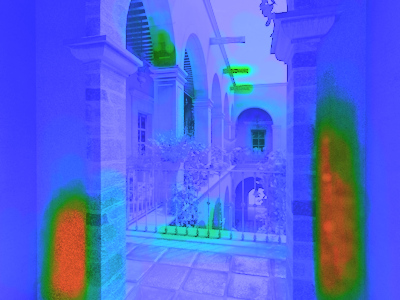
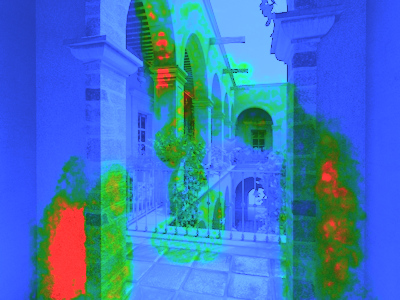
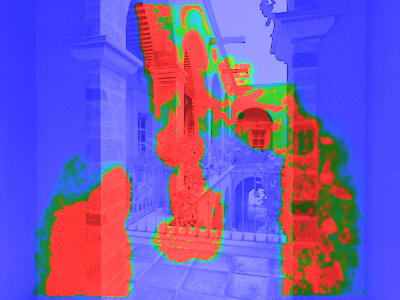
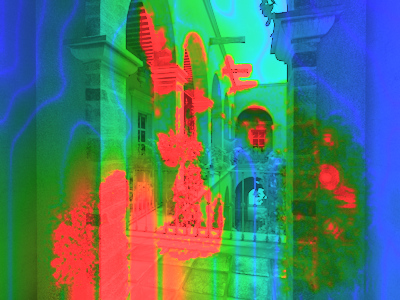
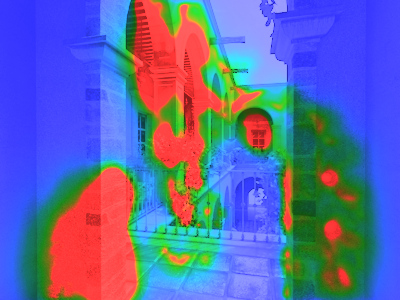
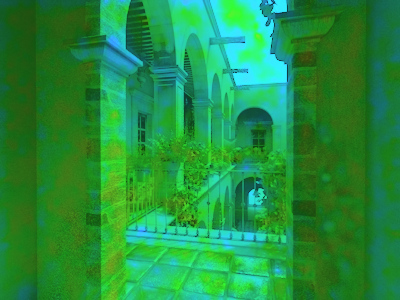
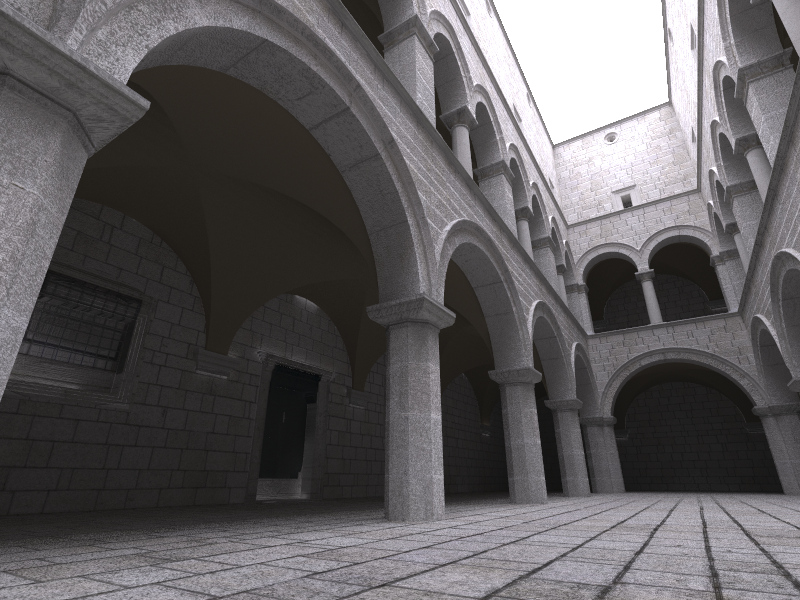
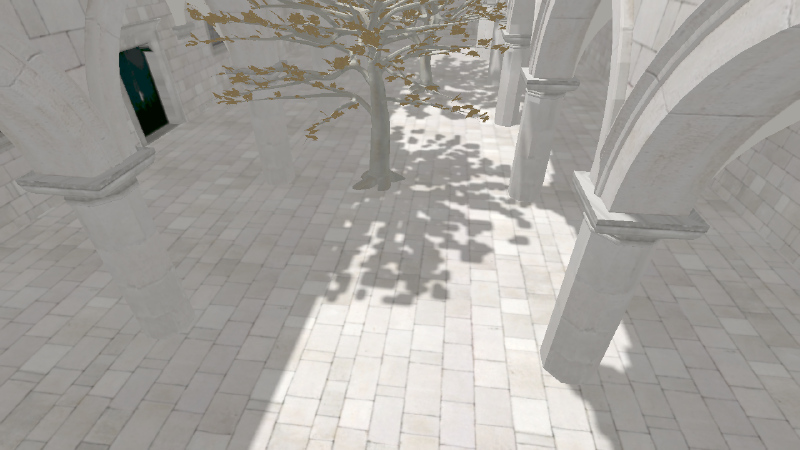
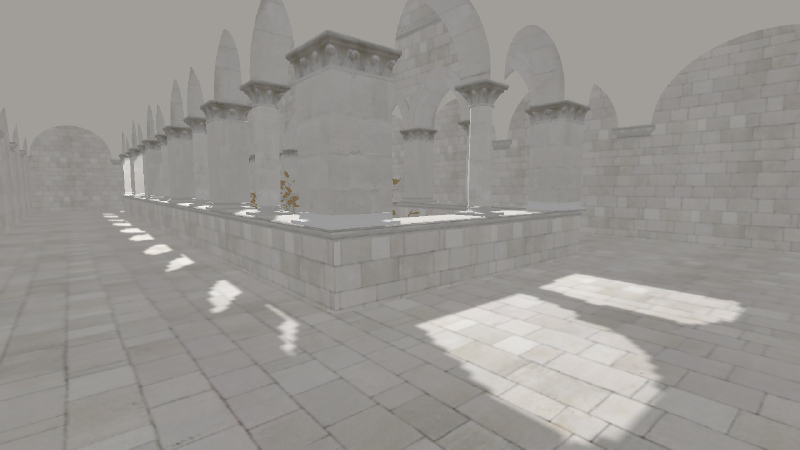
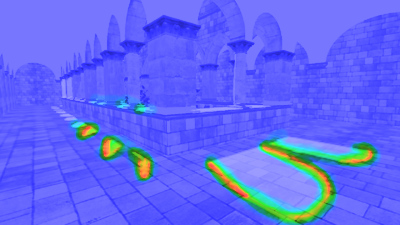
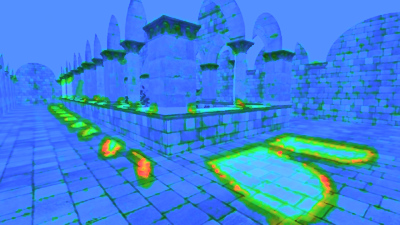
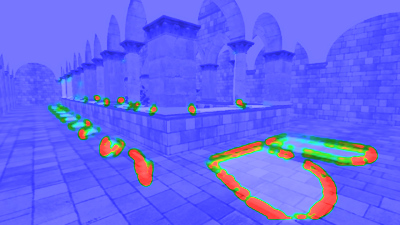
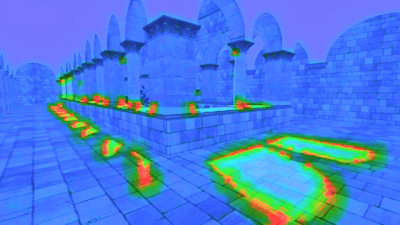
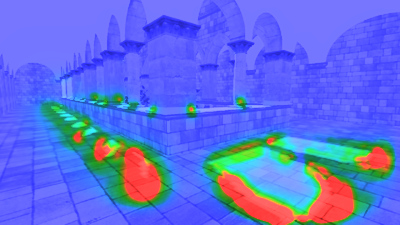
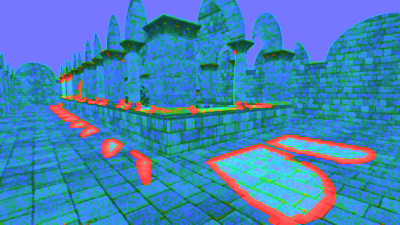
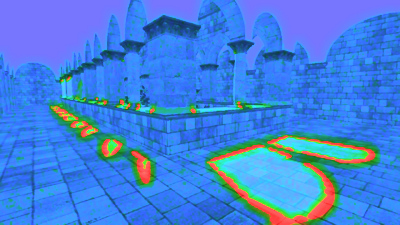
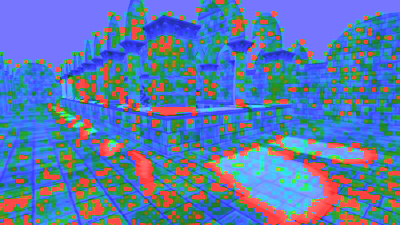
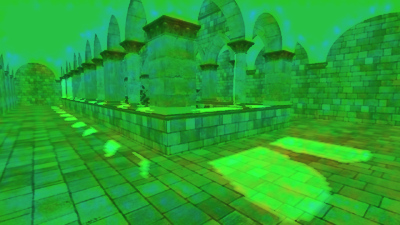
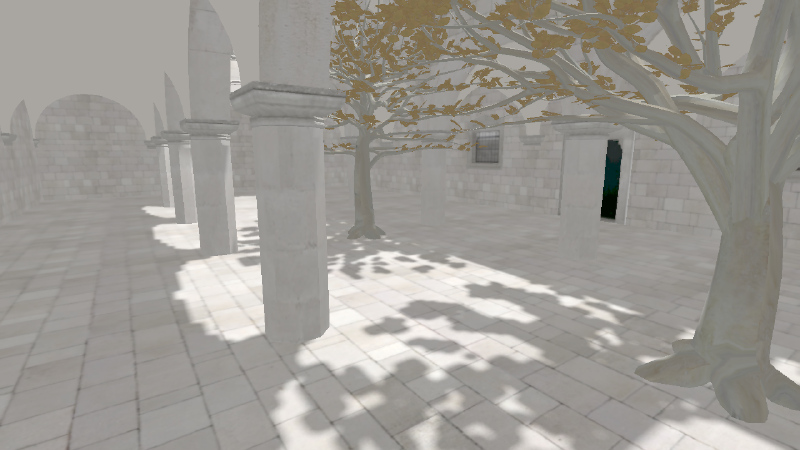
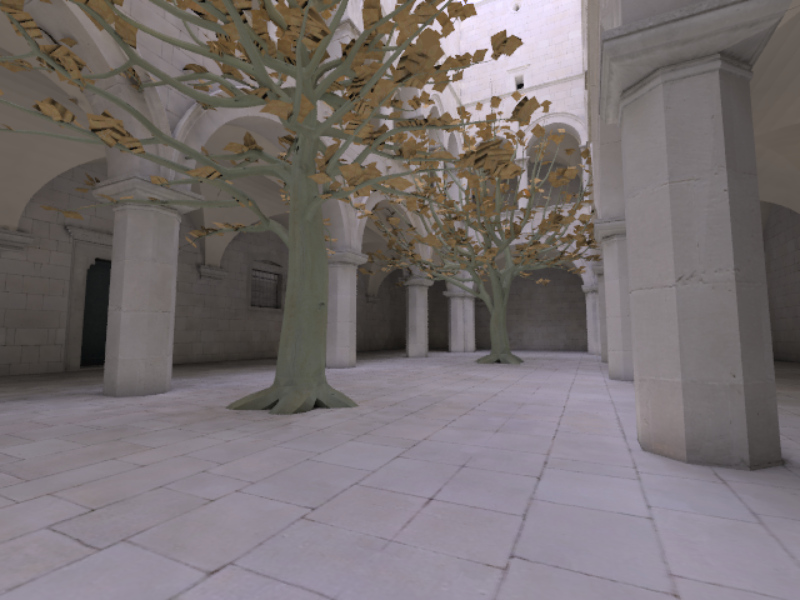
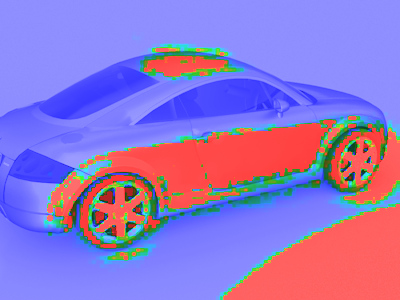
Hover the mouse over the test image to see the reference image.
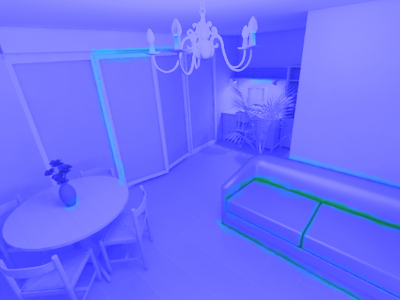
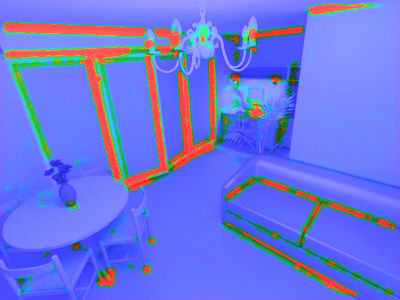
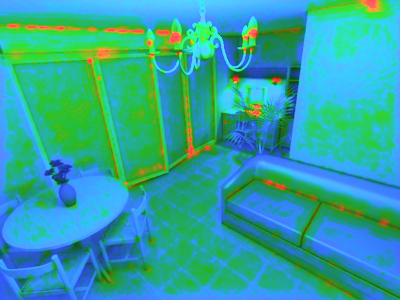
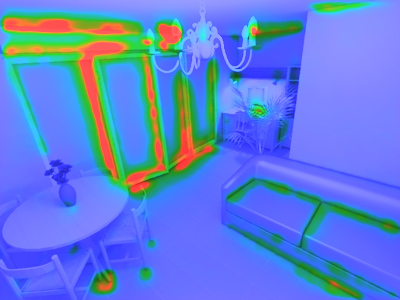
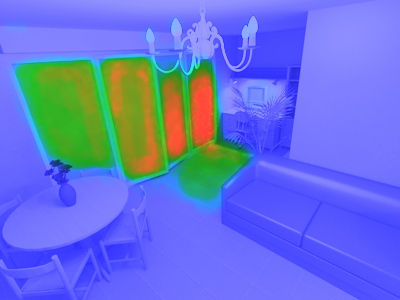
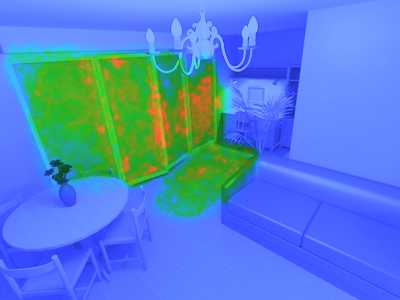
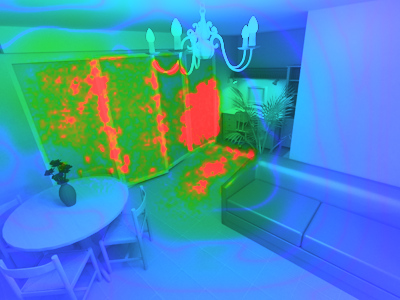
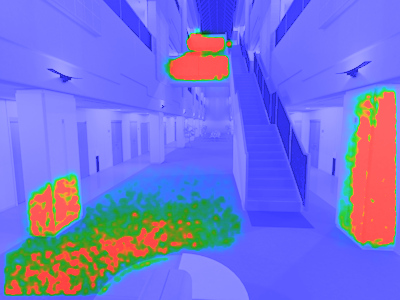
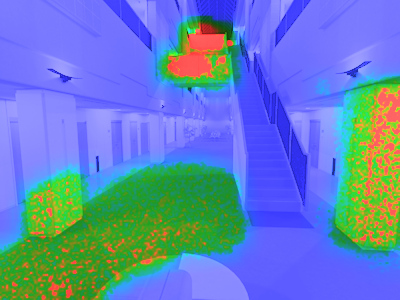
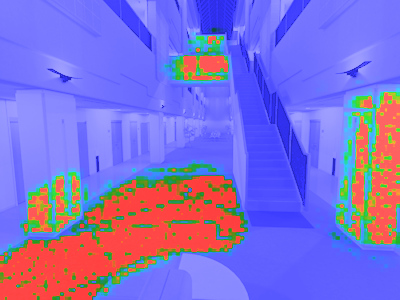
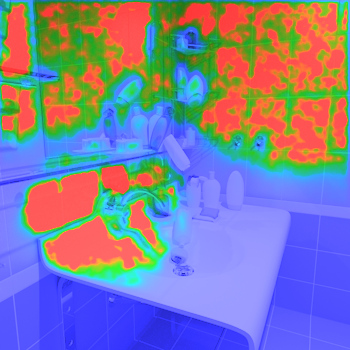
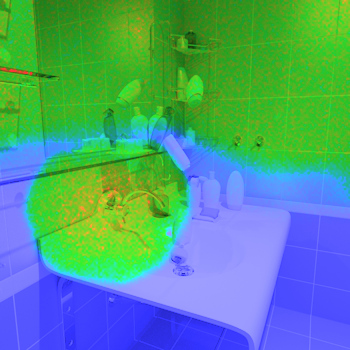
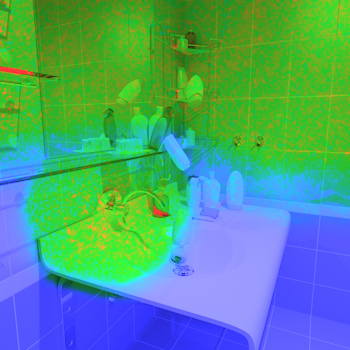
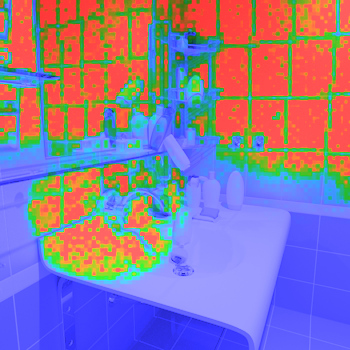
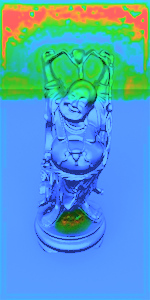
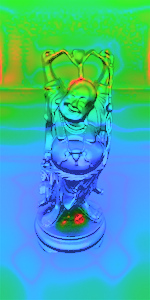
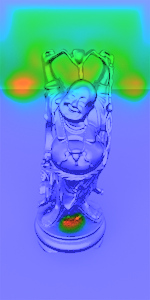
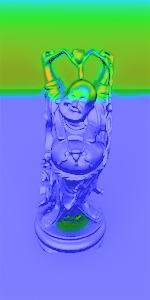
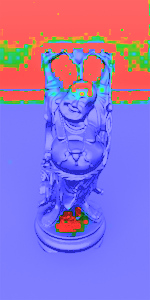
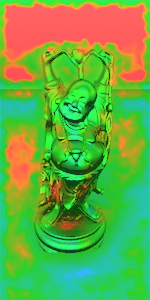
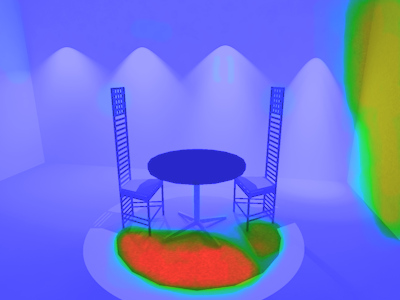
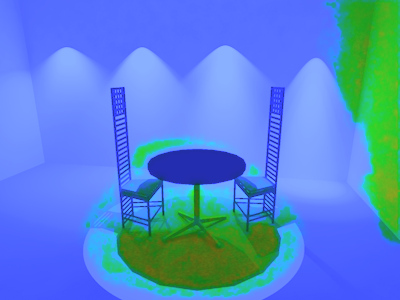
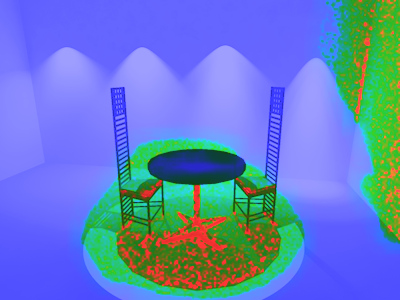
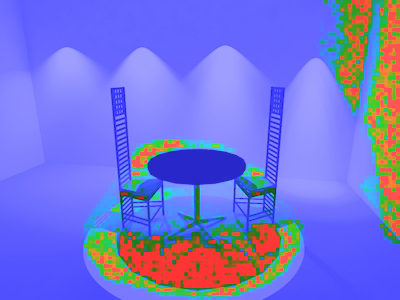
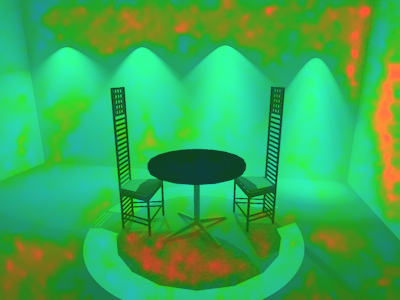
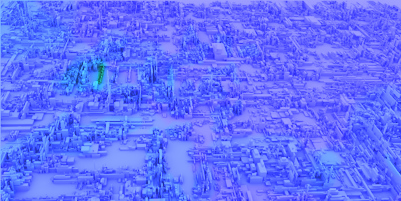
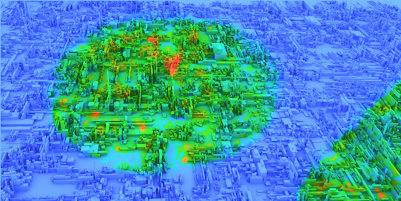
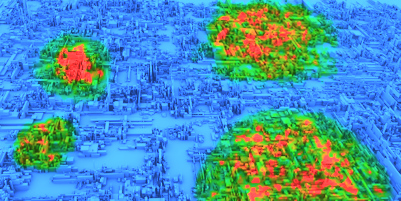
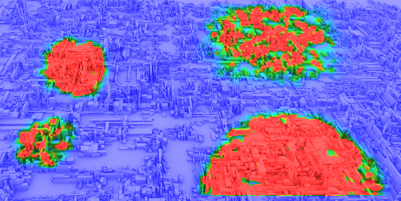
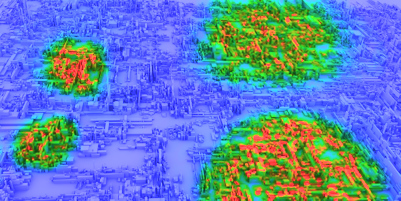
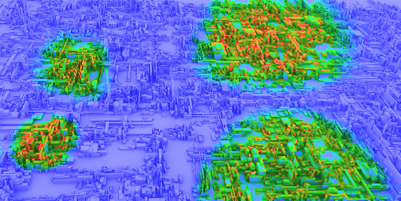
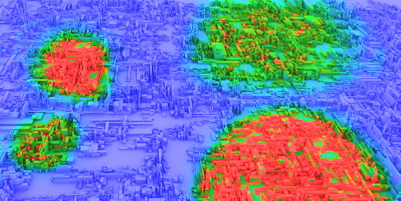
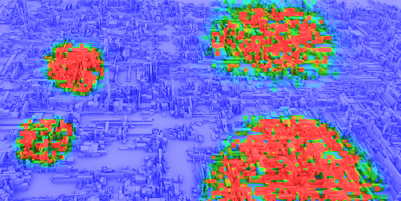
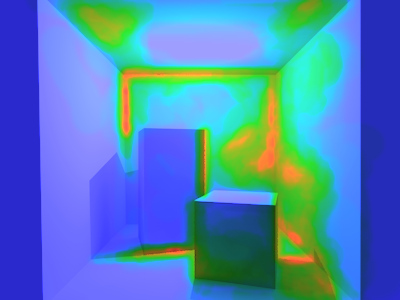
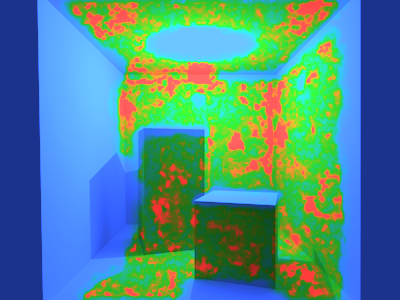
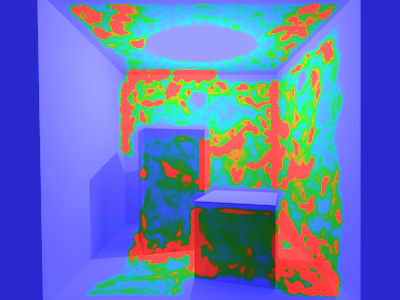
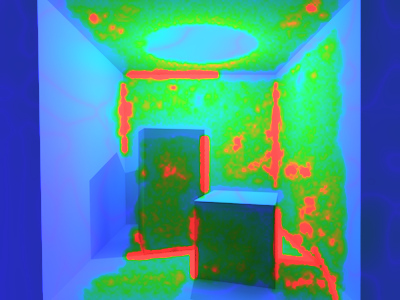
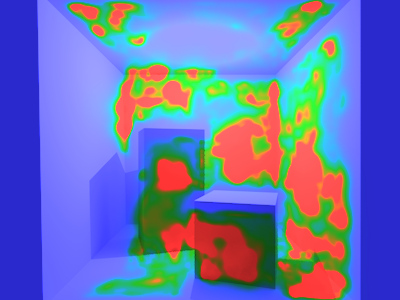
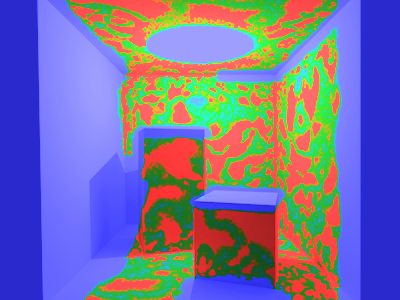
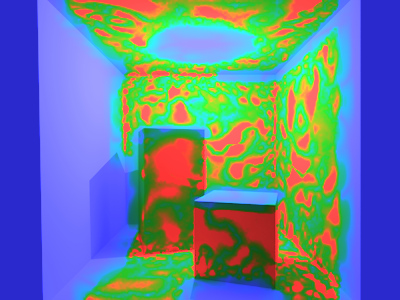
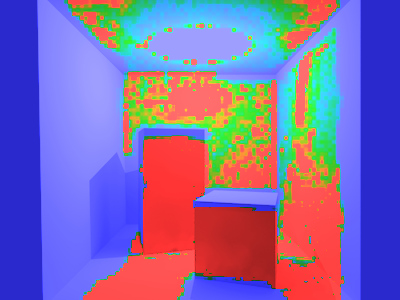
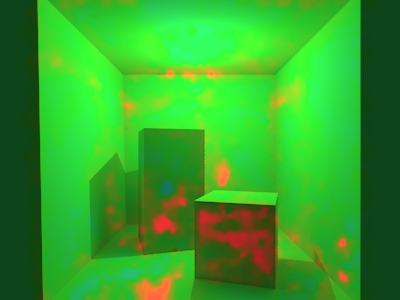
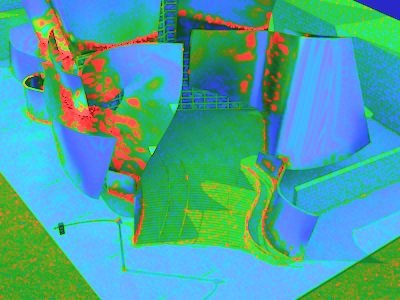
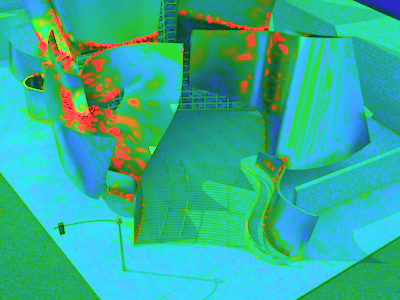
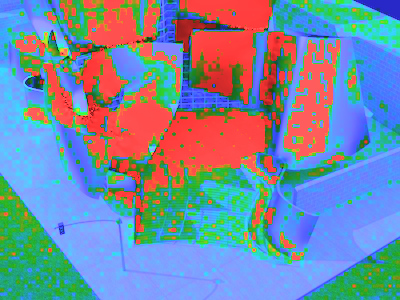
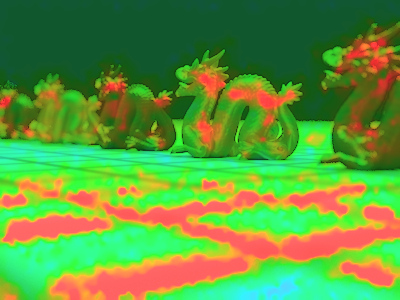
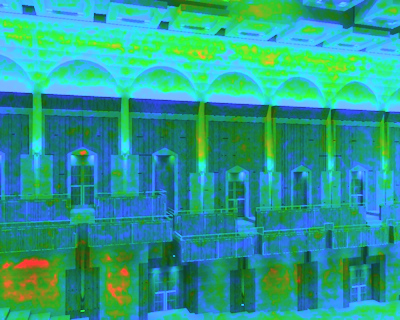
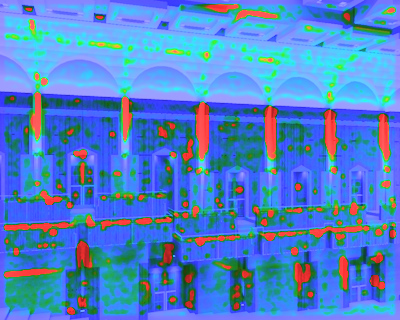
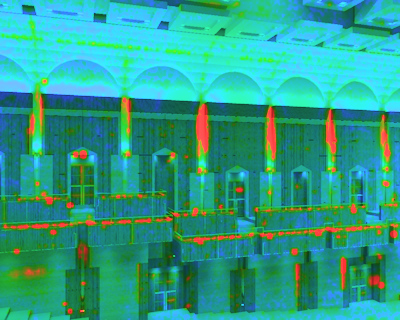
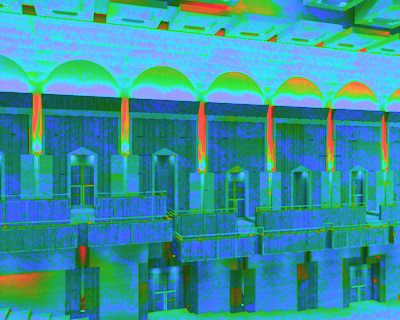
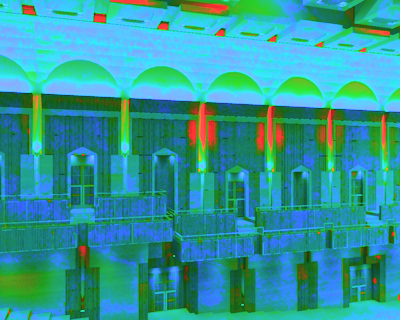
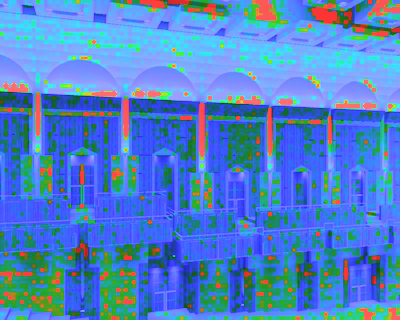
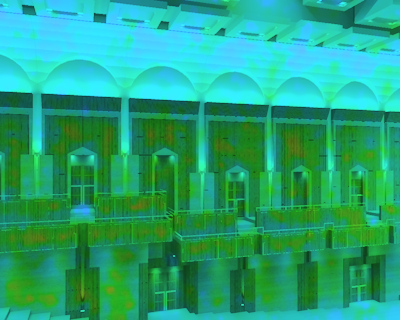
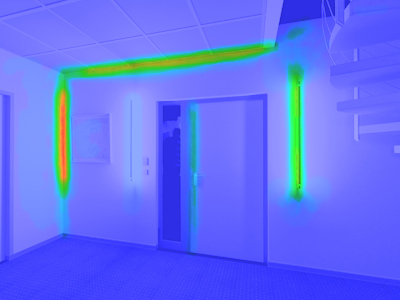
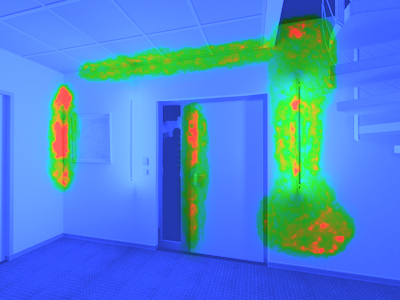
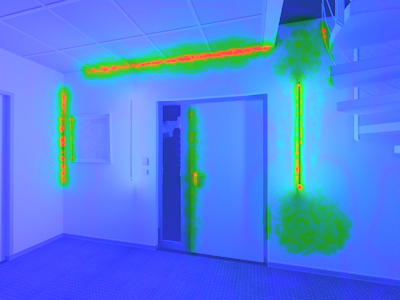
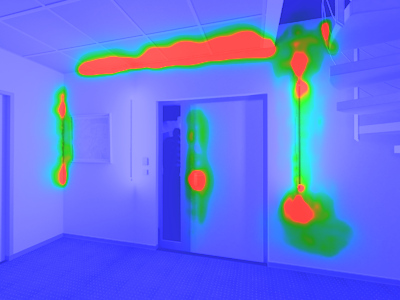
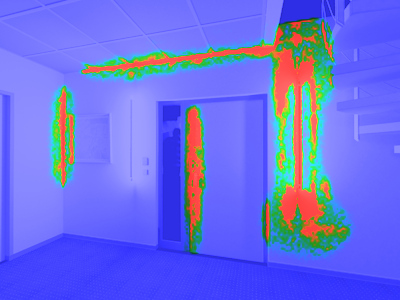
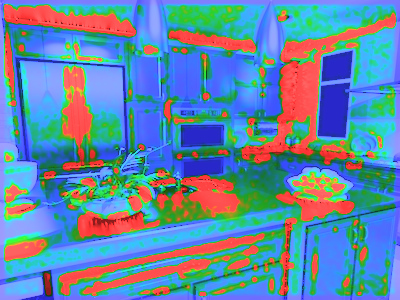
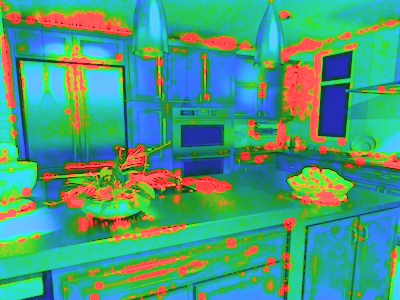
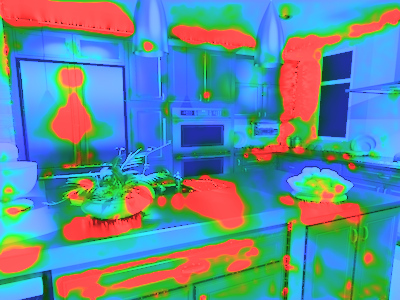
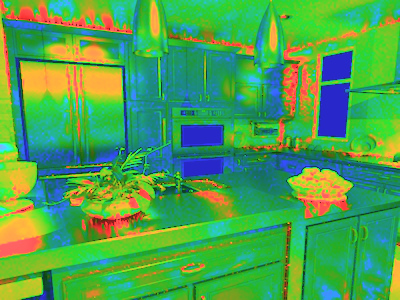
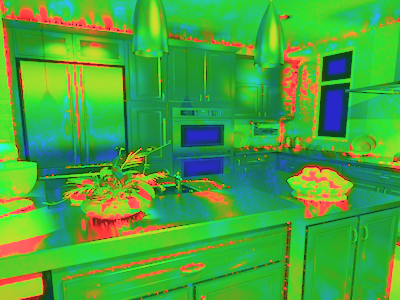
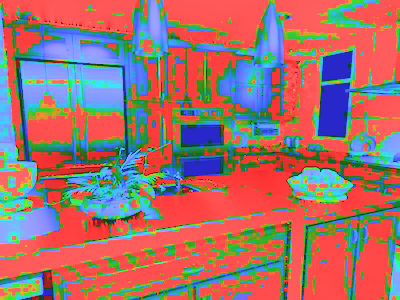
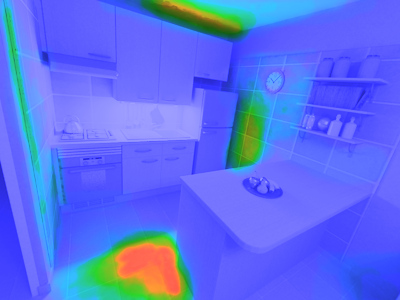
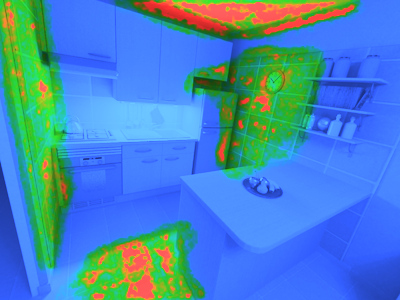
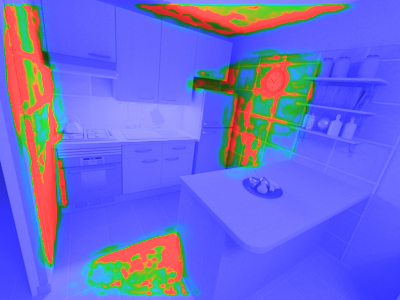
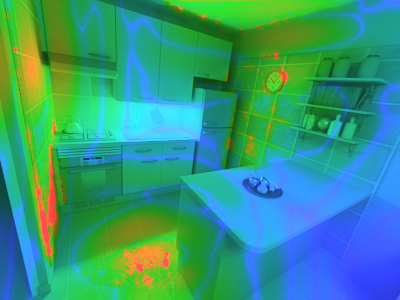
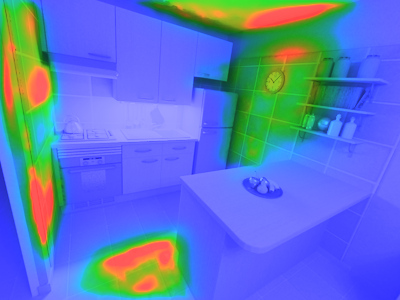
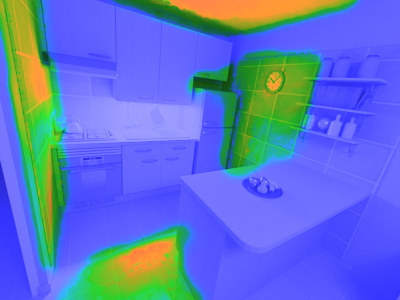
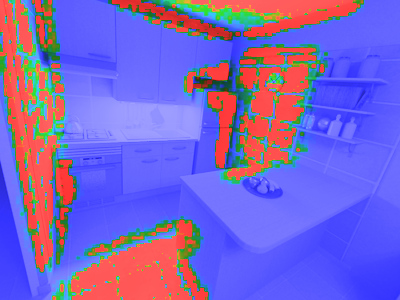
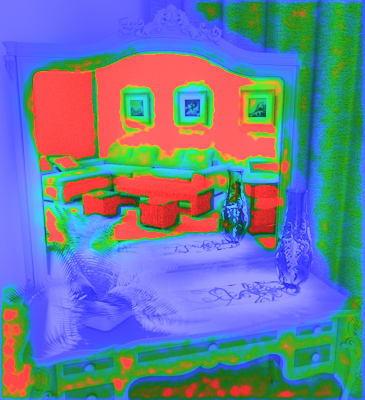
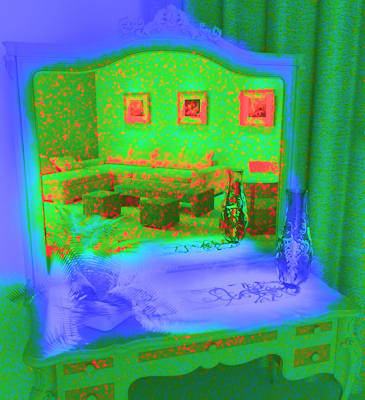
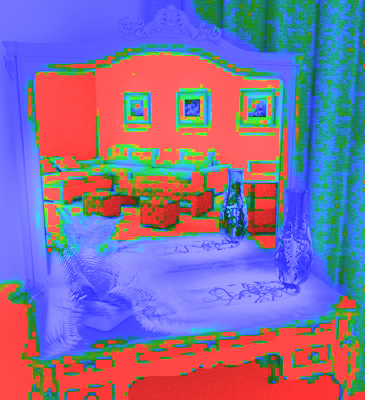
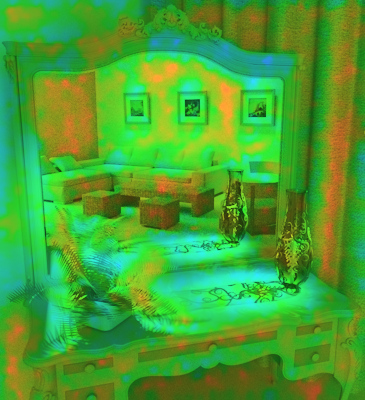
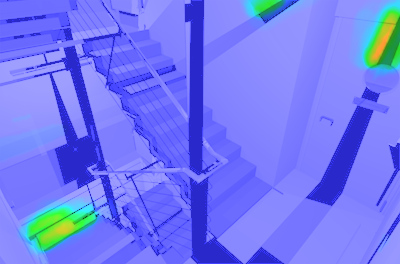
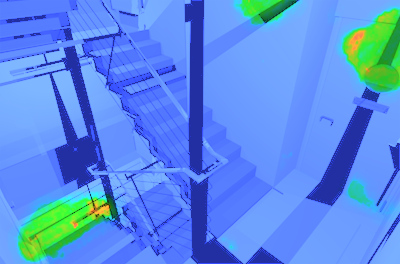
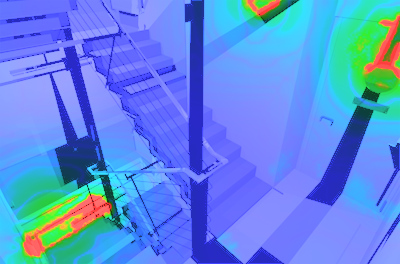
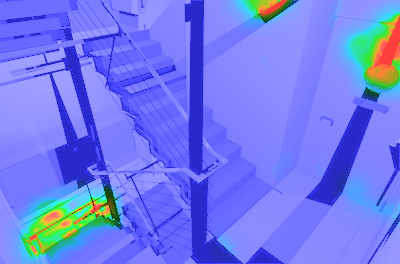
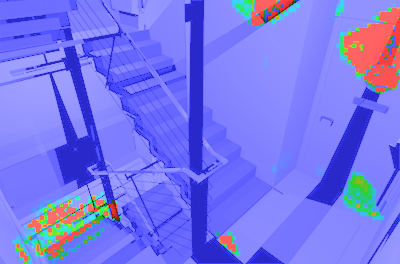
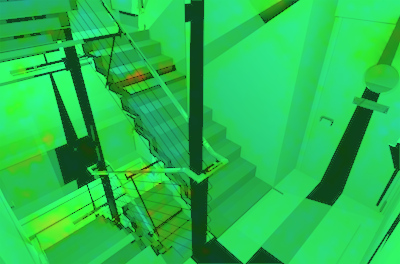
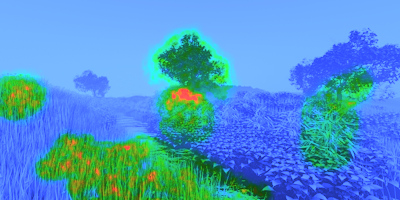
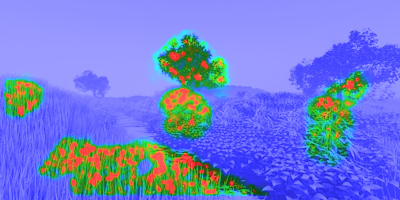
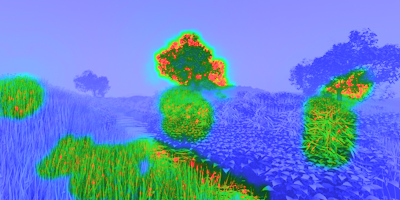
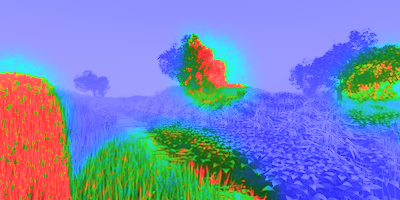
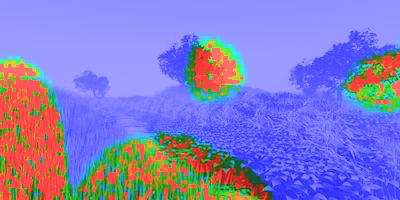
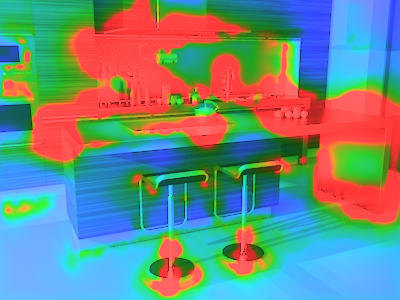
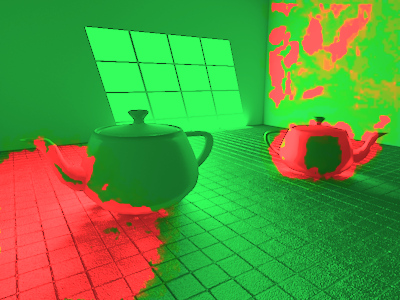
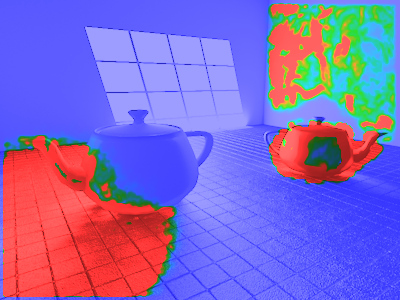
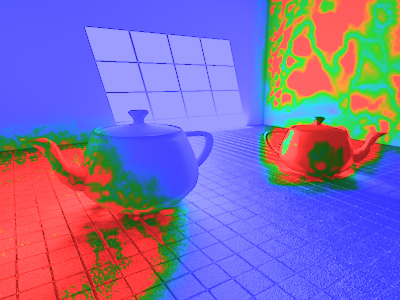
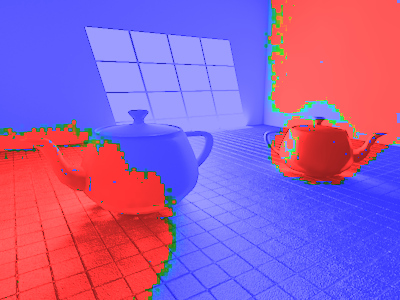
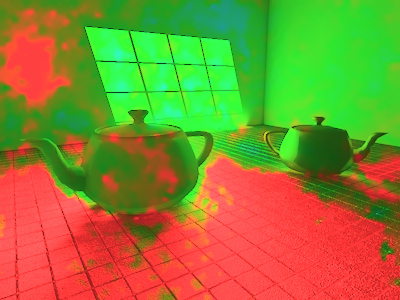
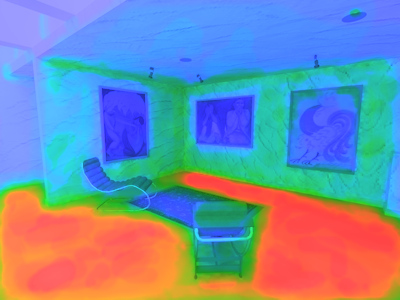
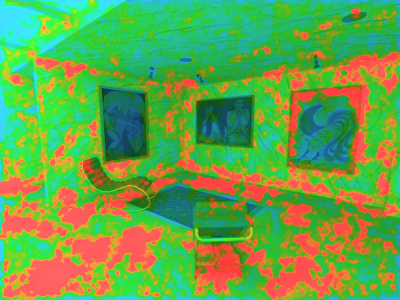
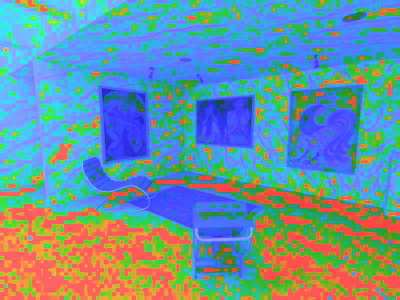
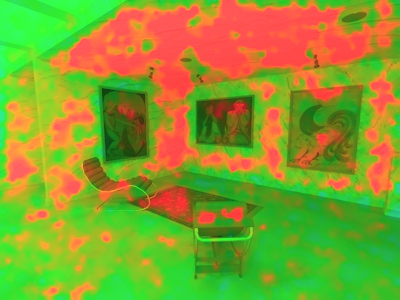
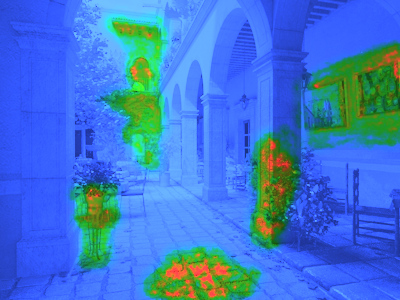
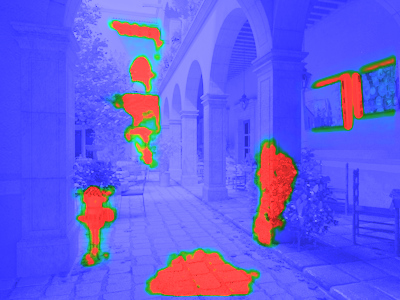
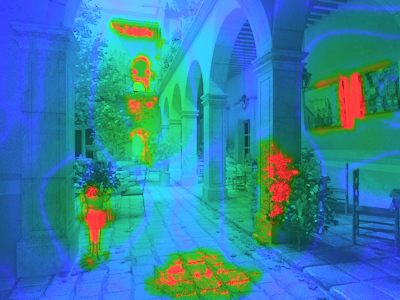
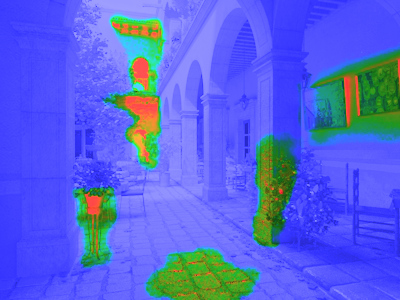
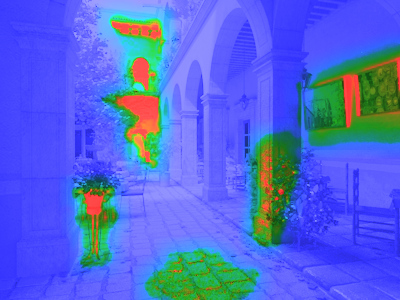
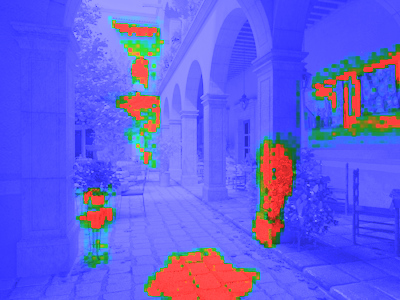
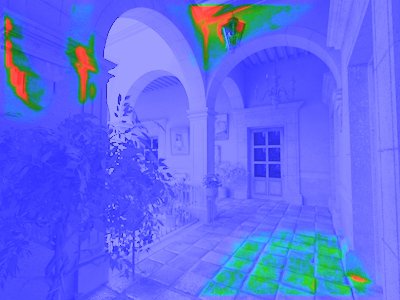
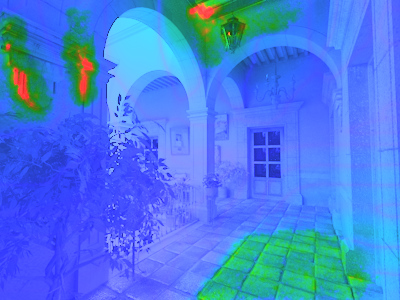
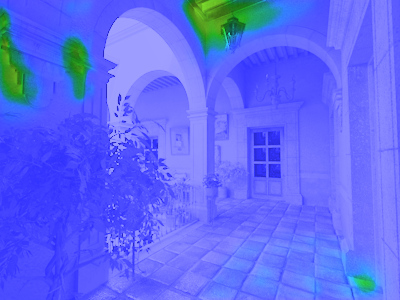
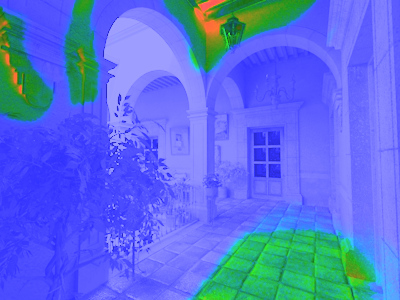
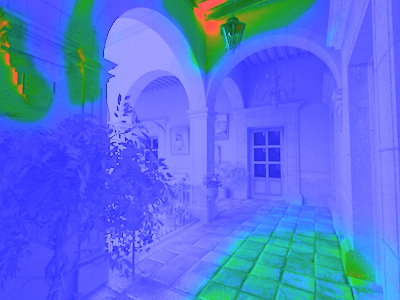
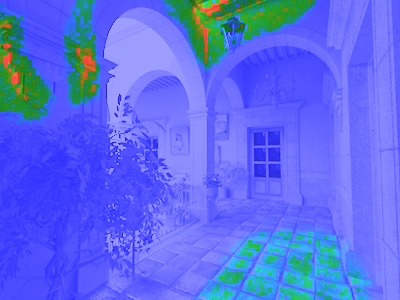
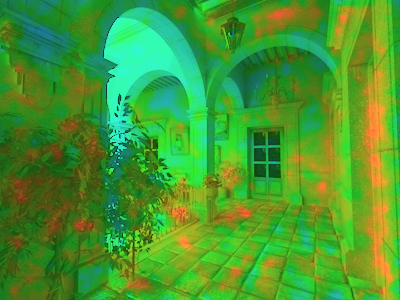
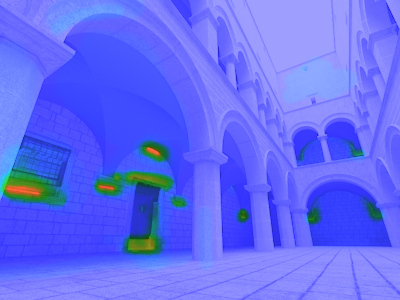
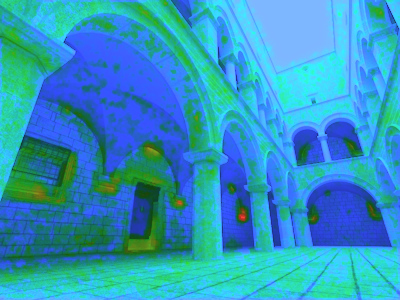
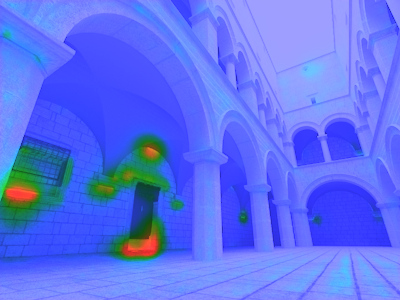
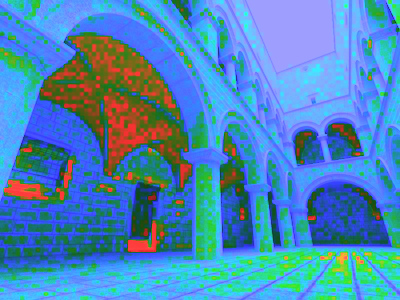
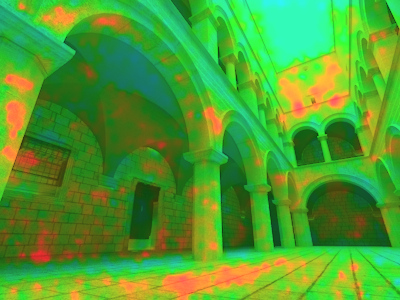
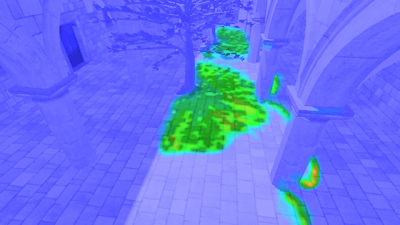
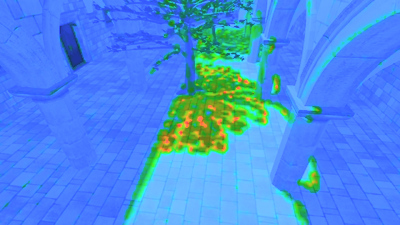
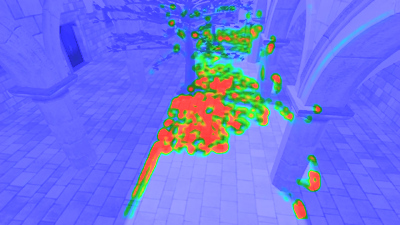
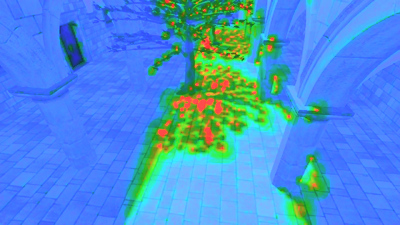
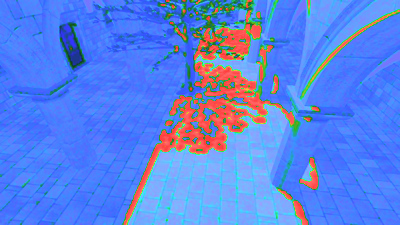
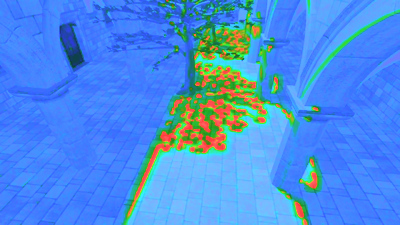
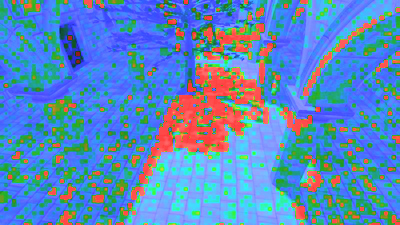
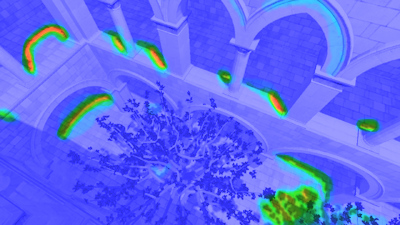
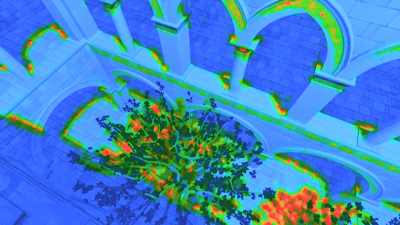
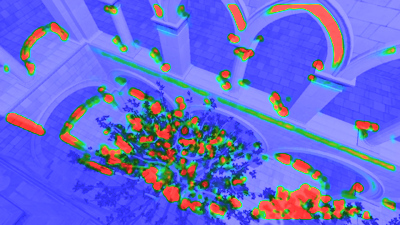
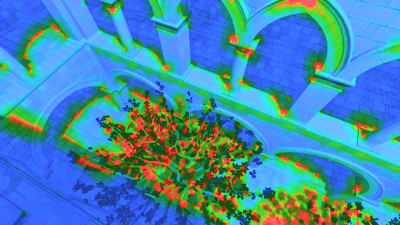
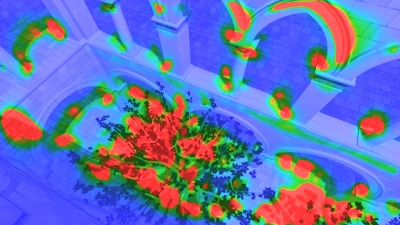
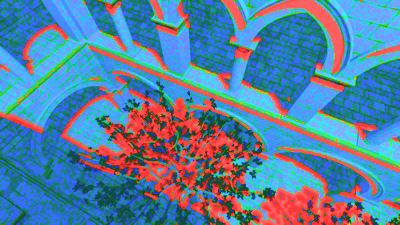
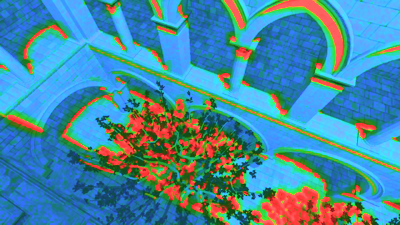
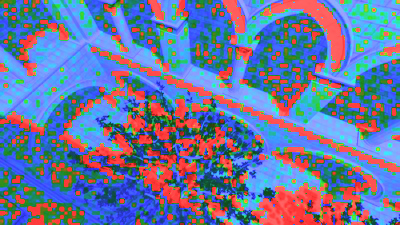
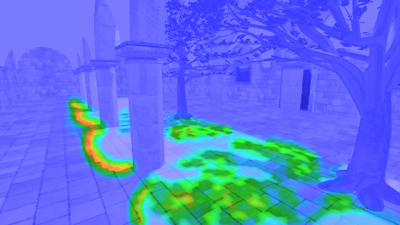
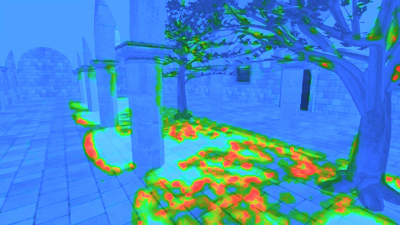
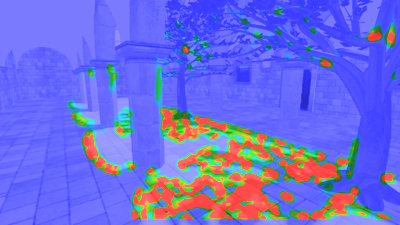
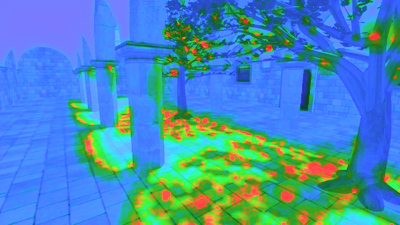
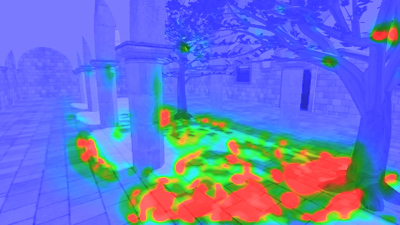
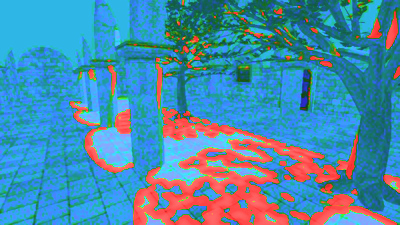
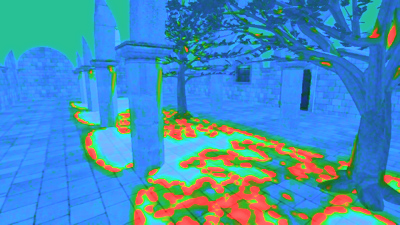
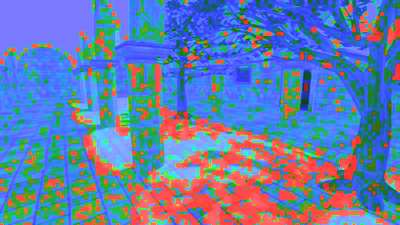
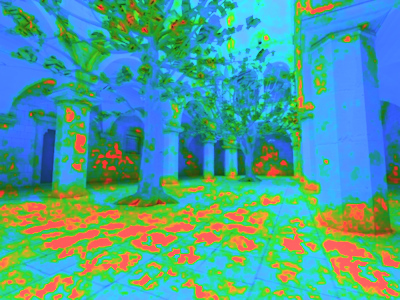
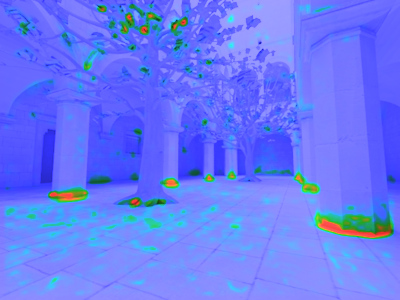
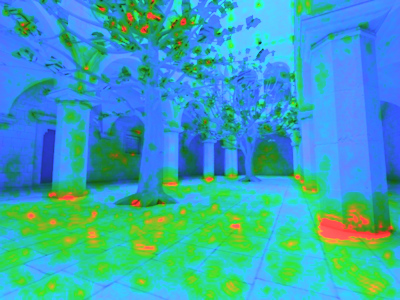
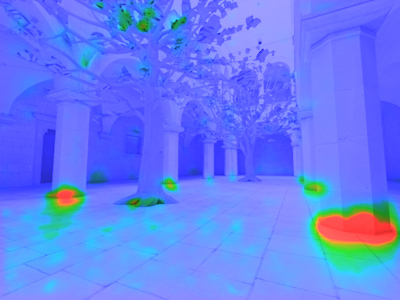
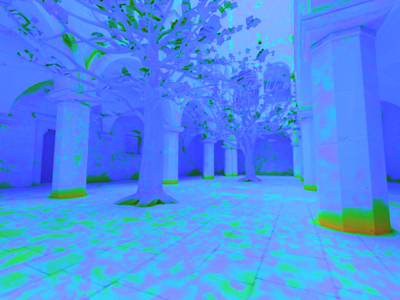
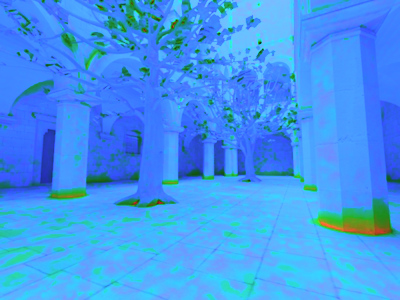
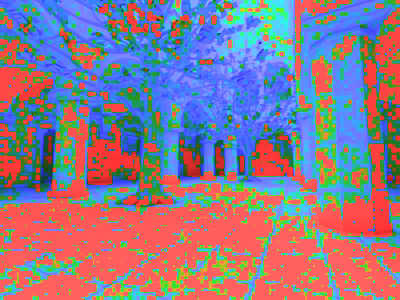
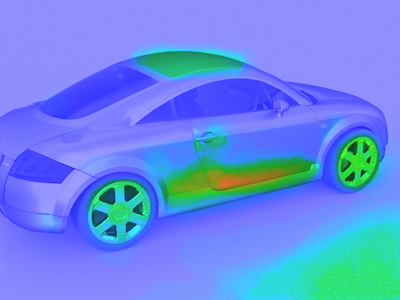
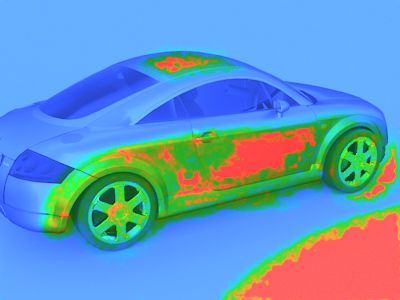
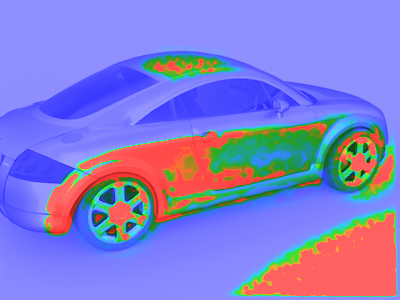
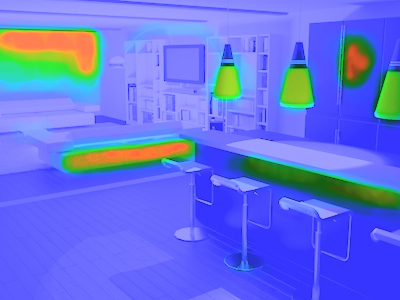
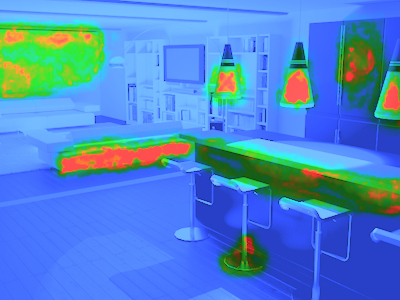
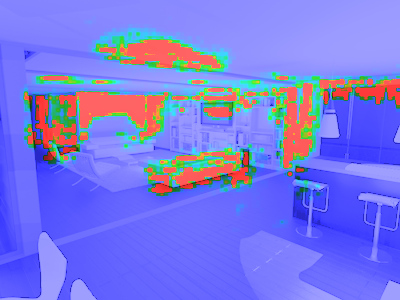
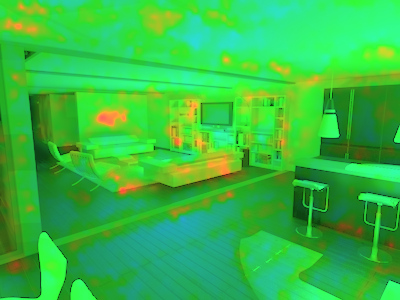
Hover the mouse over the result of a metric to see the visualization of
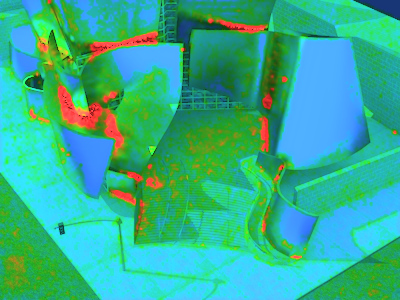
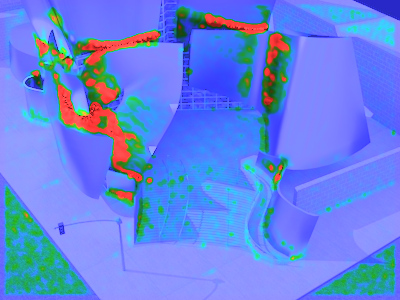
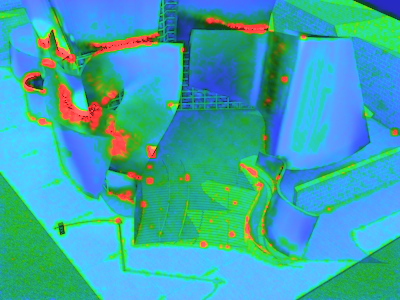
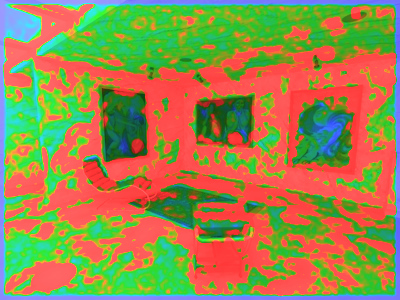
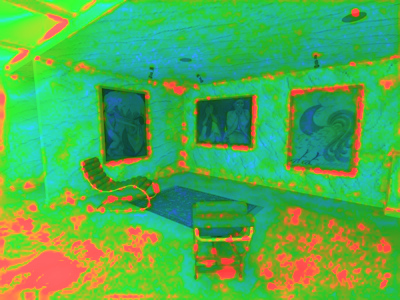
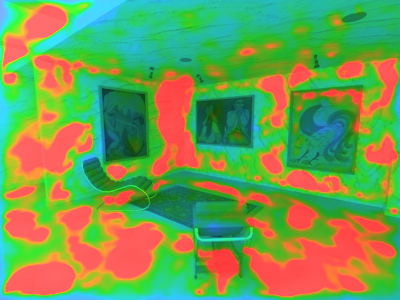
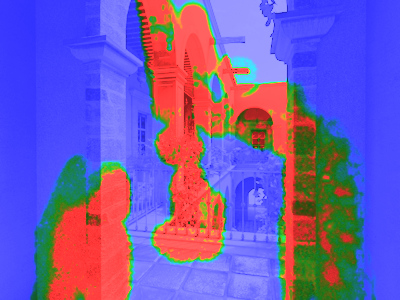
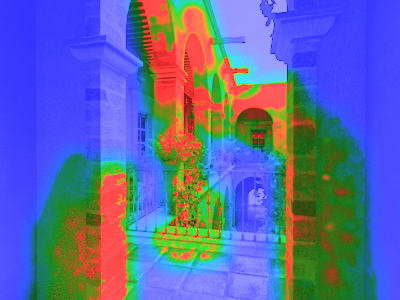
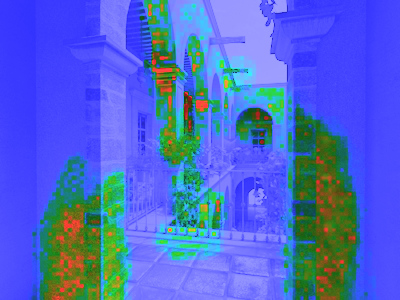
false positives and false negatives. False positives are marked with red,
false negatives with green and true positives with blue. The threshold was selected so that for all scenes
the true-postitive rate is equal 75% for the case where at least 50% of
observers mark the distortion.
 apartment - test image apartment - test image
| With-reference
 | 
 |
| Metric | auc@25 | auc@50 | rho |
|---|
| newMetric | 0.968 | NaN | 0.453 |
| SSIM | 0.913 | NaN | 0.321 |
| HDR-VDP-2 | 0.96 | NaN | 0.423 |
| MS-SSIM | 0.852 | NaN | 0.2 |
| AD | 0.948 | NaN | 0.363 |
| sCIE-Lab | 0.969 | NaN | 0.443 |
| sCorrel | 0.332 | NaN | -0.042 |
| NoRM | 0.983 | NaN | 0.331 |
|
|
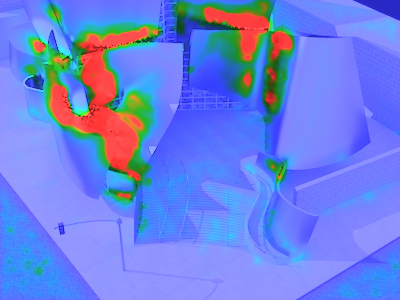
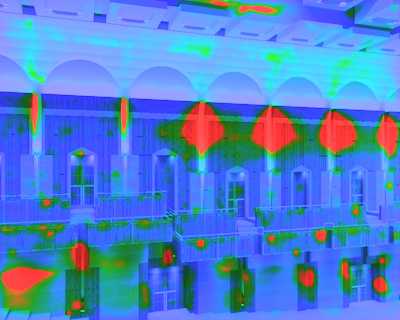
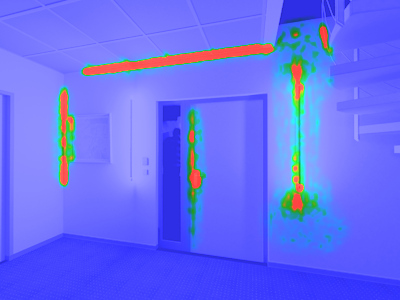
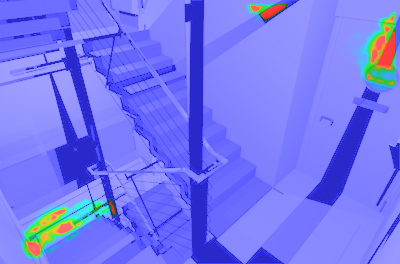
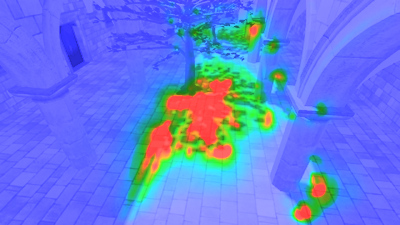
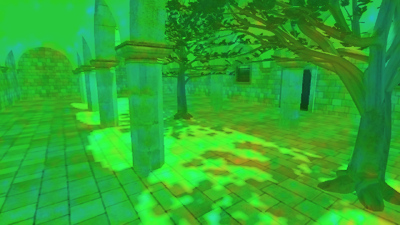
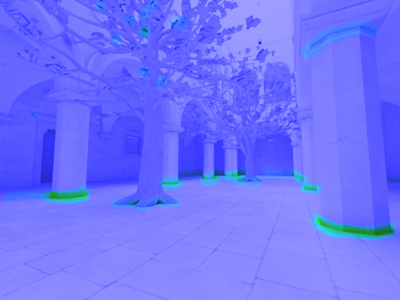
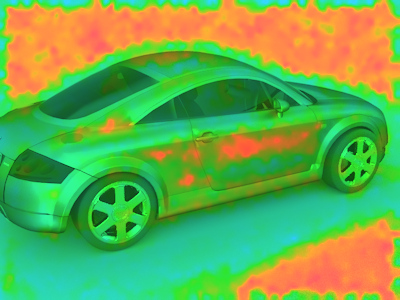
 Mean observer data - with reference experiment Mean observer data - with reference experiment
|
 newMetric - distortion map newMetric - distortion map
|
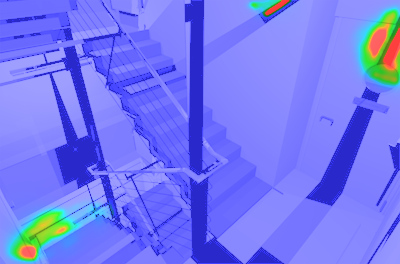
 SSIM - distortion map SSIM - distortion map
|
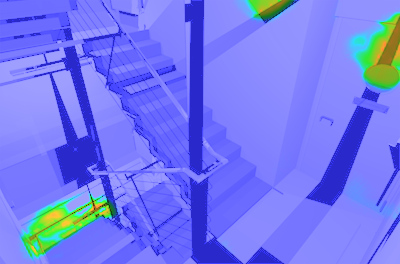
 HDR-VDP-2 - distortion map HDR-VDP-2 - distortion map
|
 MS-SSIM - distortion map MS-SSIM - distortion map
|
 AD - distortion map AD - distortion map
|
 sCIE-Lab - distortion map sCIE-Lab - distortion map
|
 sCorrel - distortion map sCorrel - distortion map
|
 NoRM - distortion map NoRM - distortion map
|
|
 appartment_II - test image appartment_II - test image
| With-reference
 | 
 |
| Metric | auc@25 | auc@50 | rho |
|---|
| newMetric | 0.991 | 0.977 | 0.596 |
| SSIM | 0.987 | 0.959 | 0.33 |
| HDR-VDP-2 | 0.981 | 0.961 | 0.353 |
| MS-SSIM | 0.981 | 0.956 | 0.322 |
| AD | 0.992 | 0.977 | 0.556 |
| sCIE-Lab | 0.992 | 0.979 | 0.612 |
| sCorrel | 0.992 | 0.982 | 0.651 |
| NoRM | 0.736 | 0.739 | 0.33 |
|
|
 Mean observer data - with reference experiment Mean observer data - with reference experiment
|
 newMetric - distortion map newMetric - distortion map
|
 SSIM - distortion map SSIM - distortion map
|
 HDR-VDP-2 - distortion map HDR-VDP-2 - distortion map
|
 MS-SSIM - distortion map MS-SSIM - distortion map
|
 AD - distortion map AD - distortion map
|
 sCIE-Lab - distortion map sCIE-Lab - distortion map
|
 sCorrel - distortion map sCorrel - distortion map
|
 NoRM - distortion map NoRM - distortion map
|
|
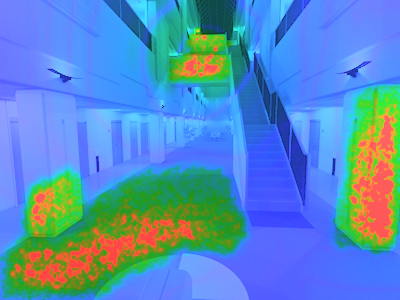
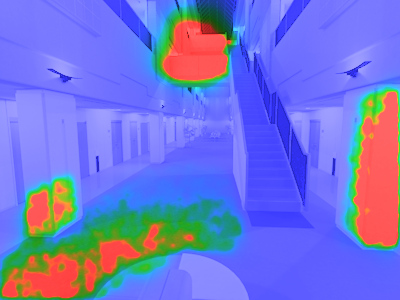
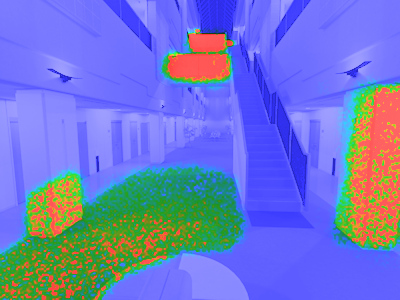
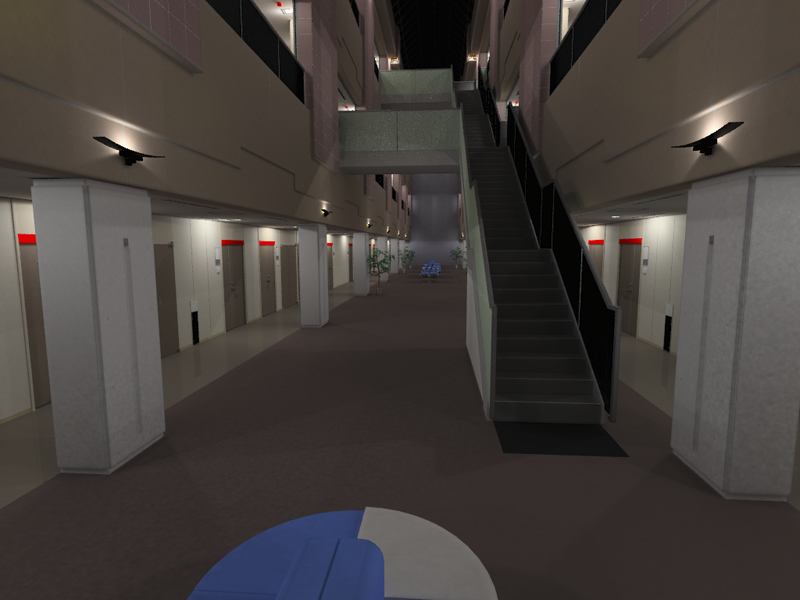 atrium - test image atrium - test image
| With-reference
 | 
 |
| Metric | auc@25 | auc@50 | rho |
|---|
| newMetric | 0.961 | 0.976 | 0.815 |
| SSIM | 0.941 | 0.951 | 0.77 |
| HDR-VDP-2 | 0.935 | 0.953 | 0.751 |
| MS-SSIM | 0.934 | 0.949 | 0.734 |
| AD | 0.954 | 0.956 | 0.755 |
| sCIE-Lab | 0.953 | 0.945 | 0.693 |
| sCorrel | 0.934 | 0.931 | 0.616 |
| NoRM | 0.803 | 0.82 | 0.463 |
|
|
 Mean observer data - with reference experiment Mean observer data - with reference experiment
|
 newMetric - distortion map newMetric - distortion map
|
 SSIM - distortion map SSIM - distortion map
|
 HDR-VDP-2 - distortion map HDR-VDP-2 - distortion map
|
 MS-SSIM - distortion map MS-SSIM - distortion map
|
 AD - distortion map AD - distortion map
|
 sCIE-Lab - distortion map sCIE-Lab - distortion map
|
 sCorrel - distortion map sCorrel - distortion map
|
 NoRM - distortion map NoRM - distortion map
|
|
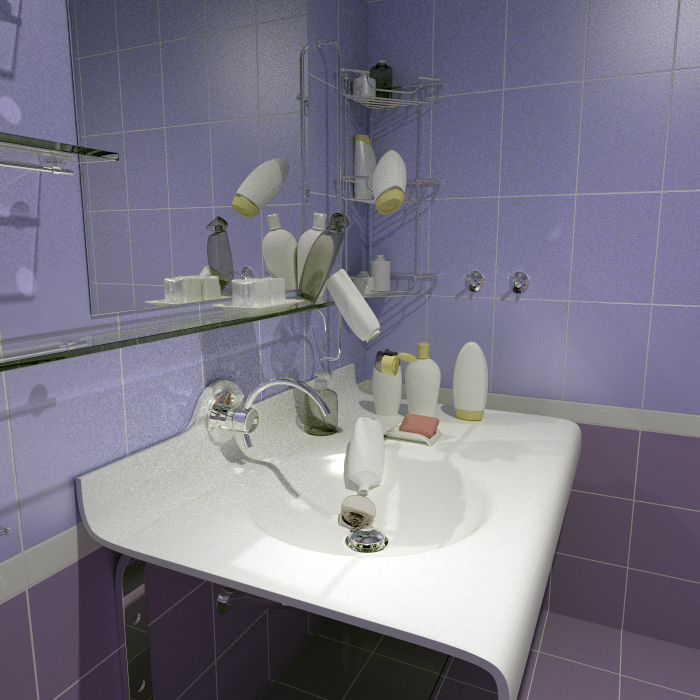 bathroom - test image bathroom - test image
| With-reference
 | 
 |
| Metric | auc@25 | auc@50 | rho |
|---|
| newMetric | 0.98 | 0.959 | 0.82 |
| SSIM | 0.958 | 0.931 | 0.807 |
| HDR-VDP-2 | 0.987 | 0.955 | 0.811 |
| MS-SSIM | 0.988 | 0.969 | 0.846 |
| AD | 0.979 | 0.93 | 0.699 |
| sCIE-Lab | 0.982 | 0.929 | 0.669 |
| sCorrel | 0.978 | 0.946 | 0.759 |
| NoRM | 0.865 | 0.853 | 0.573 |
|
|
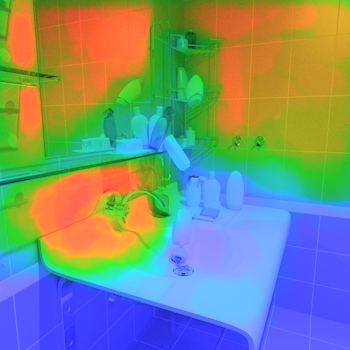 Mean observer data - with reference experiment Mean observer data - with reference experiment
|
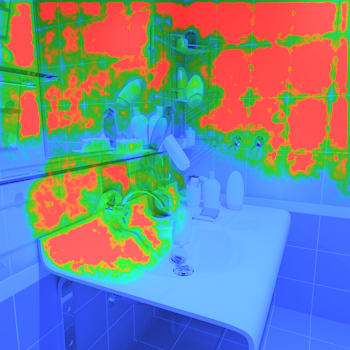 newMetric - distortion map newMetric - distortion map
|
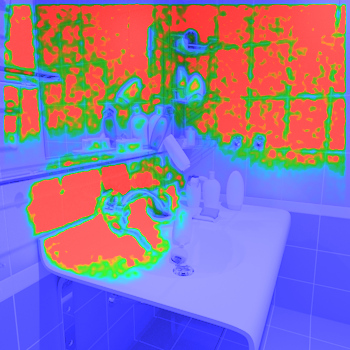 SSIM - distortion map SSIM - distortion map
|
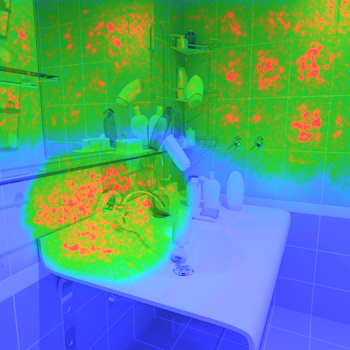 HDR-VDP-2 - distortion map HDR-VDP-2 - distortion map
|
 MS-SSIM - distortion map MS-SSIM - distortion map
|
 AD - distortion map AD - distortion map
|
 sCIE-Lab - distortion map sCIE-Lab - distortion map
|
 sCorrel - distortion map sCorrel - distortion map
|
 NoRM - distortion map NoRM - distortion map
|
|
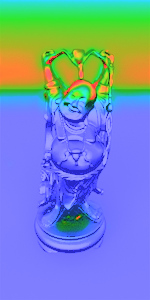
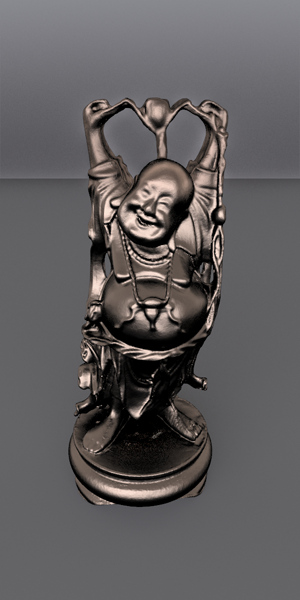 buddha - test image buddha - test image
| With-reference
 | 
 |
| Metric | auc@25 | auc@50 | rho |
|---|
| newMetric | 0.838 | 0.886 | 0.128 |
| SSIM | 0.933 | 0.887 | 0.344 |
| HDR-VDP-2 | 0.883 | 0.869 | 0.13 |
| MS-SSIM | 0.935 | 0.945 | 0.388 |
| AD | 0.901 | 0.822 | 0.325 |
| sCIE-Lab | 0.897 | 0.812 | 0.251 |
| sCorrel | 0.852 | 0.825 | 0.207 |
| NoRM | 0.704 | 0.523 | 0.184 |
|
|
 Mean observer data - with reference experiment Mean observer data - with reference experiment
|
 newMetric - distortion map newMetric - distortion map
|
 SSIM - distortion map SSIM - distortion map
|
 HDR-VDP-2 - distortion map HDR-VDP-2 - distortion map
|
 MS-SSIM - distortion map MS-SSIM - distortion map
|
 AD - distortion map AD - distortion map
|
 sCIE-Lab - distortion map sCIE-Lab - distortion map
|
 sCorrel - distortion map sCorrel - distortion map
|
 NoRM - distortion map NoRM - distortion map
|
|
 cg figures - test image cg figures - test image
| With-reference
 | 
 |
| Metric | auc@25 | auc@50 | rho |
|---|
| newMetric | 0.971 | 0.982 | 0.557 |
| SSIM | 0.967 | 0.975 | 0.518 |
| HDR-VDP-2 | 0.976 | 0.987 | 0.708 |
| MS-SSIM | 0.967 | 0.969 | 0.538 |
| AD | 0.94 | 0.972 | 0.582 |
| sCIE-Lab | 0.925 | 0.954 | 0.572 |
| sCorrel | 0.859 | 0.869 | 0.13 |
| NoRM | 0.731 | 0.759 | 0.25 |
|
|
 Mean observer data - with reference experiment Mean observer data - with reference experiment
|
 newMetric - distortion map newMetric - distortion map
|
 SSIM - distortion map SSIM - distortion map
|
 HDR-VDP-2 - distortion map HDR-VDP-2 - distortion map
|
 MS-SSIM - distortion map MS-SSIM - distortion map
|
 AD - distortion map AD - distortion map
|
 sCIE-Lab - distortion map sCIE-Lab - distortion map
|
 sCorrel - distortion map sCorrel - distortion map
|
 NoRM - distortion map NoRM - distortion map
|
|
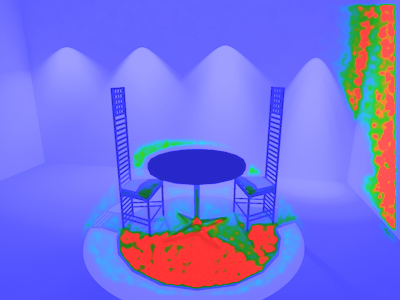
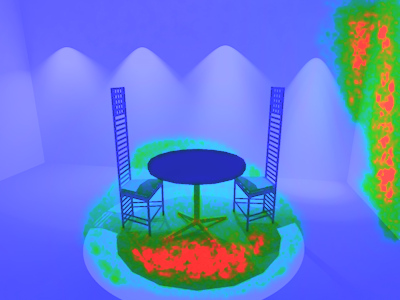
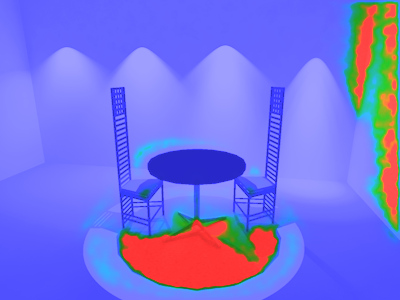
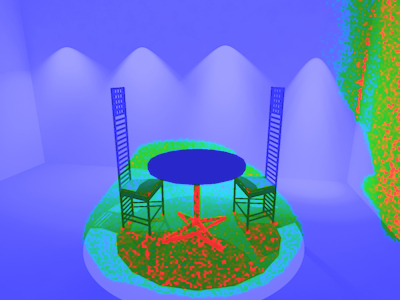
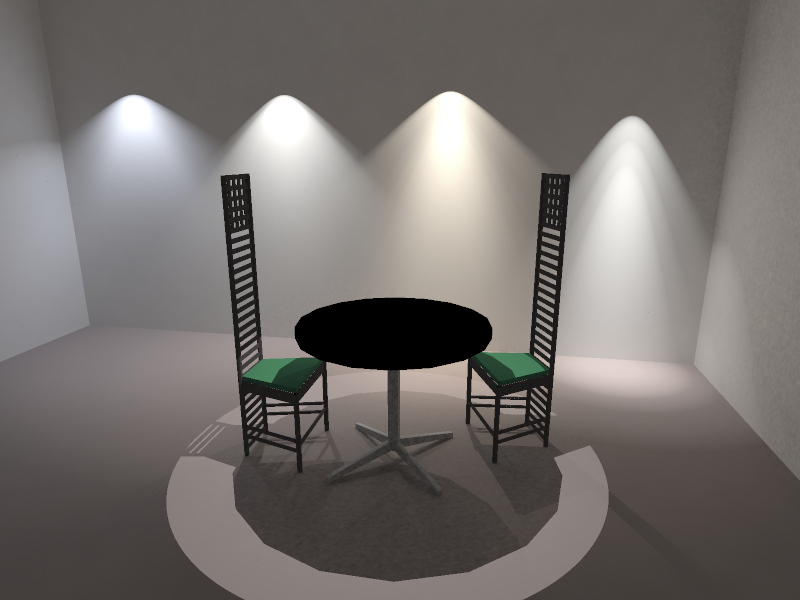 chairs - test image chairs - test image
| With-reference
 | 
 |
| Metric | auc@25 | auc@50 | rho |
|---|
| newMetric | 0.984 | 0.991 | 0.765 |
| SSIM | 0.948 | 0.951 | 0.694 |
| HDR-VDP-2 | 0.987 | 0.991 | 0.748 |
| MS-SSIM | 0.983 | 0.991 | 0.8 |
| AD | 0.961 | 0.975 | 0.653 |
| sCIE-Lab | 0.961 | 0.964 | 0.578 |
| sCorrel | 0.957 | 0.964 | 0.531 |
| NoRM | 0.798 | 0.84 | 0.495 |
|
|
 Mean observer data - with reference experiment Mean observer data - with reference experiment
|
 newMetric - distortion map newMetric - distortion map
|
 SSIM - distortion map SSIM - distortion map
|
 HDR-VDP-2 - distortion map HDR-VDP-2 - distortion map
|
 MS-SSIM - distortion map MS-SSIM - distortion map
|
 AD - distortion map AD - distortion map
|
 sCIE-Lab - distortion map sCIE-Lab - distortion map
|
 sCorrel - distortion map sCorrel - distortion map
|
 NoRM - distortion map NoRM - distortion map
|
|
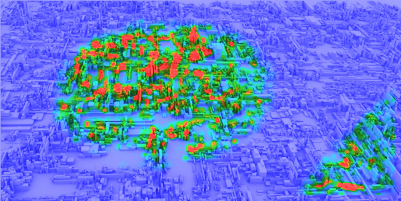
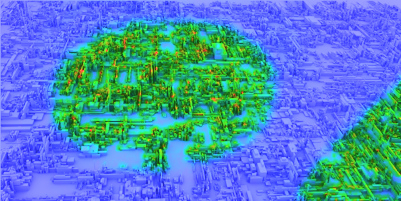
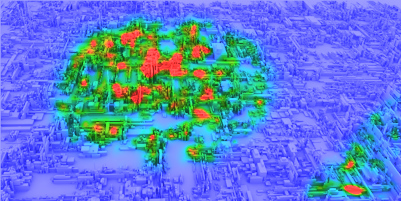
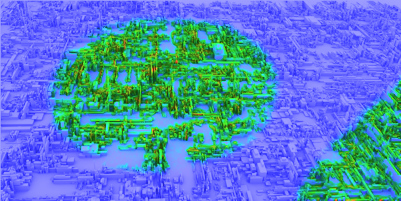
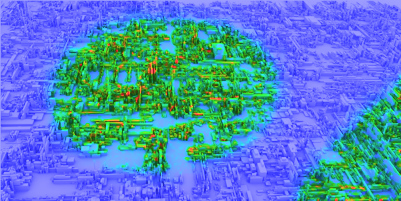
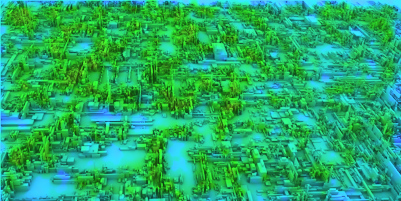
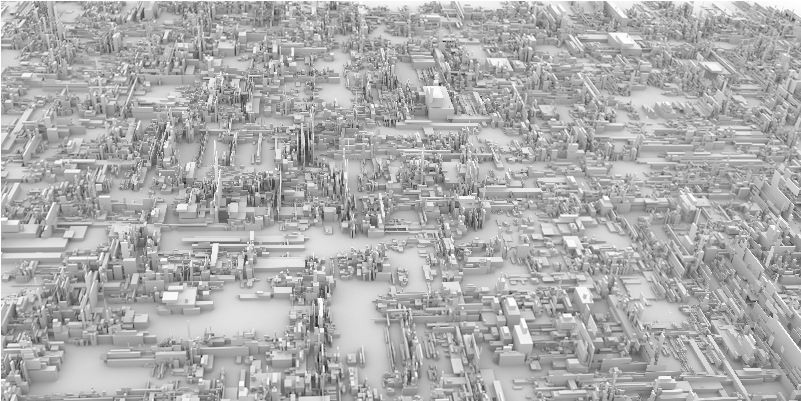 city-d - test image city-d - test image
| With-reference
 | 
 |
| Metric | auc@25 | auc@50 | rho |
|---|
| newMetric | 0.909 | NaN | 0.052 |
| SSIM | 0.942 | NaN | 0.072 |
| HDR-VDP-2 | 0.949 | NaN | 0.081 |
| MS-SSIM | 0.866 | NaN | 0.055 |
| AD | 0.922 | NaN | 0.09 |
| sCIE-Lab | 0.893 | NaN | 0.055 |
| sCorrel | 0.929 | NaN | 0.082 |
| NoRM | 0.823 | NaN | 0.286 |
|
|
 Mean observer data - with reference experiment Mean observer data - with reference experiment
|
 newMetric - distortion map newMetric - distortion map
|
 SSIM - distortion map SSIM - distortion map
|
 HDR-VDP-2 - distortion map HDR-VDP-2 - distortion map
|
 MS-SSIM - distortion map MS-SSIM - distortion map
|
 AD - distortion map AD - distortion map
|
 sCIE-Lab - distortion map sCIE-Lab - distortion map
|
 sCorrel - distortion map sCorrel - distortion map
|
 NoRM - distortion map NoRM - distortion map
|
|
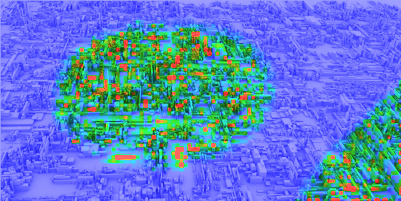
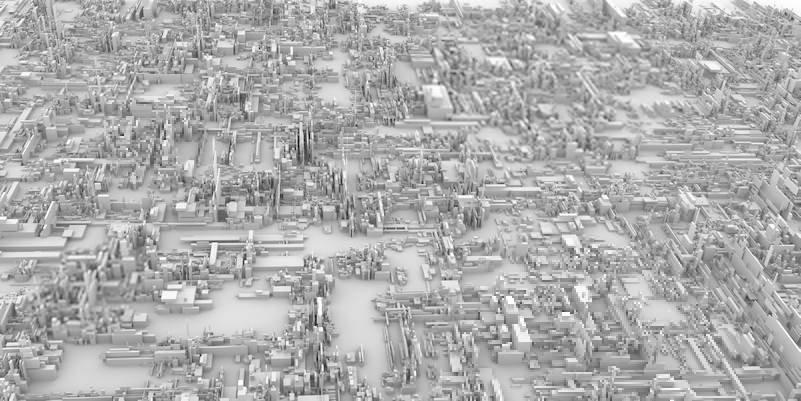 city-u - test image city-u - test image
| With-reference
 | 
 |
| Metric | auc@25 | auc@50 | rho |
|---|
| newMetric | 0.921 | 0.897 | 0.685 |
| SSIM | 0.901 | 0.855 | 0.619 |
| HDR-VDP-2 | 0.94 | 0.896 | 0.715 |
| MS-SSIM | 0.891 | 0.831 | 0.554 |
| AD | 0.942 | 0.911 | 0.738 |
| sCIE-Lab | 0.902 | 0.832 | 0.587 |
| sCorrel | 0.937 | 0.891 | 0.707 |
| NoRM | 0.539 | 0.551 | 0.137 |
|
|
 Mean observer data - with reference experiment Mean observer data - with reference experiment
|
 newMetric - distortion map newMetric - distortion map
|
 SSIM - distortion map SSIM - distortion map
|
 HDR-VDP-2 - distortion map HDR-VDP-2 - distortion map
|
 MS-SSIM - distortion map MS-SSIM - distortion map
|
 AD - distortion map AD - distortion map
|
 sCIE-Lab - distortion map sCIE-Lab - distortion map
|
 sCorrel - distortion map sCorrel - distortion map
|
 NoRM - distortion map NoRM - distortion map
|
|
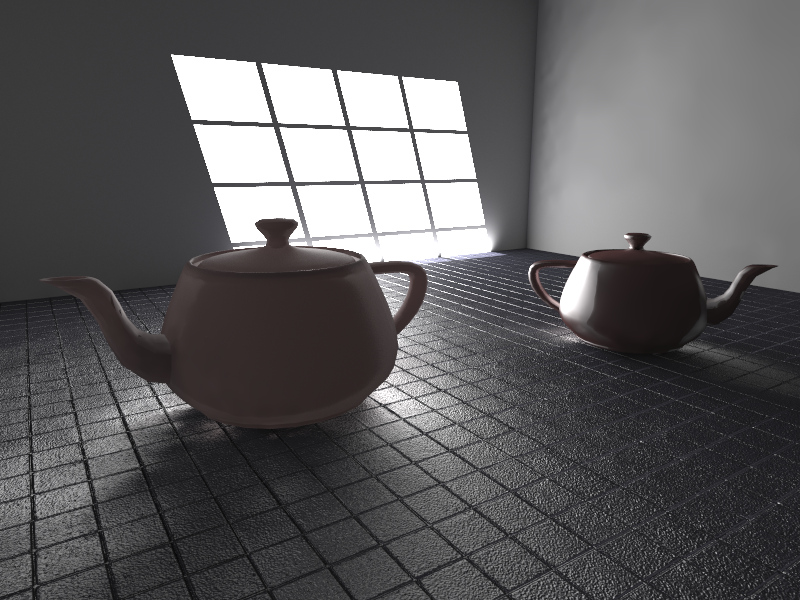
 cornell - test image cornell - test image
| With-reference
 | 
 |
| Metric | auc@25 | auc@50 | rho |
|---|
| newMetric | 0.88 | 0.864 | 0.576 |
| SSIM | 0.912 | 0.916 | 0.691 |
| HDR-VDP-2 | 0.887 | 0.917 | 0.667 |
| MS-SSIM | 0.9 | 0.887 | 0.64 |
| AD | 0.829 | 0.82 | 0.471 |
| sCIE-Lab | 0.85 | 0.818 | 0.473 |
| sCorrel | 0.813 | 0.781 | 0.438 |
| NoRM | 0.725 | 0.702 | 0.329 |
|
|
 Mean observer data - with reference experiment Mean observer data - with reference experiment
|
 newMetric - distortion map newMetric - distortion map
|
 SSIM - distortion map SSIM - distortion map
|
 HDR-VDP-2 - distortion map HDR-VDP-2 - distortion map
|
 MS-SSIM - distortion map MS-SSIM - distortion map
|
 AD - distortion map AD - distortion map
|
 sCIE-Lab - distortion map sCIE-Lab - distortion map
|
 sCorrel - distortion map sCorrel - distortion map
|
 NoRM - distortion map NoRM - distortion map
|
|
 disney - test image disney - test image
| With-reference
 | 
 |
| Metric | auc@25 | auc@50 | rho |
|---|
| newMetric | 0.864 | 0.915 | 0.498 |
| SSIM | 0.902 | 0.961 | 0.626 |
| HDR-VDP-2 | 0.855 | 0.927 | 0.577 |
| MS-SSIM | 0.949 | 0.958 | 0.549 |
| AD | 0.789 | 0.853 | 0.389 |
| sCIE-Lab | 0.853 | 0.908 | 0.406 |
| sCorrel | 0.752 | 0.794 | 0.253 |
| NoRM | 0.491 | 0.58 | 0.07 |
|
|
 Mean observer data - with reference experiment Mean observer data - with reference experiment
|
 newMetric - distortion map newMetric - distortion map
|
 SSIM - distortion map SSIM - distortion map
|
 HDR-VDP-2 - distortion map HDR-VDP-2 - distortion map
|
 MS-SSIM - distortion map MS-SSIM - distortion map
|
 AD - distortion map AD - distortion map
|
 sCIE-Lab - distortion map sCIE-Lab - distortion map
|
 sCorrel - distortion map sCorrel - distortion map
|
 NoRM - distortion map NoRM - distortion map
|
|
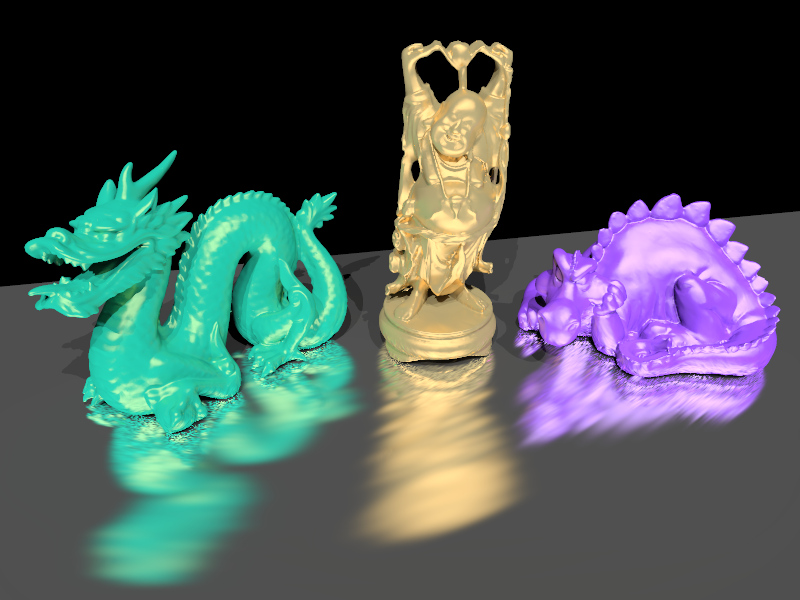
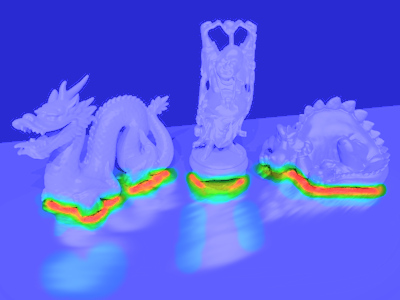
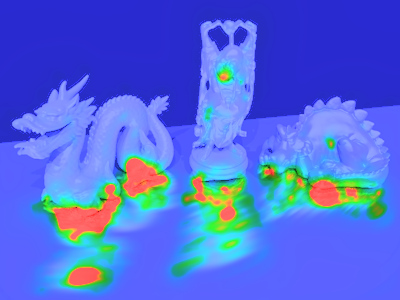
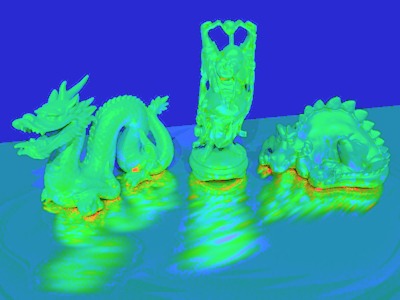
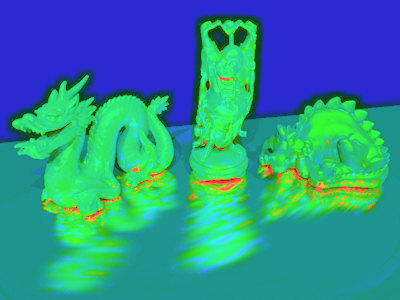
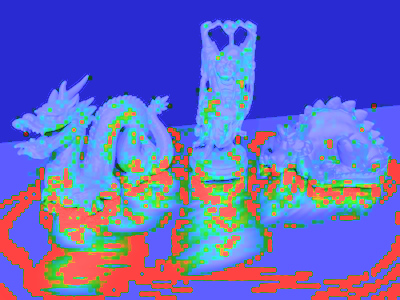
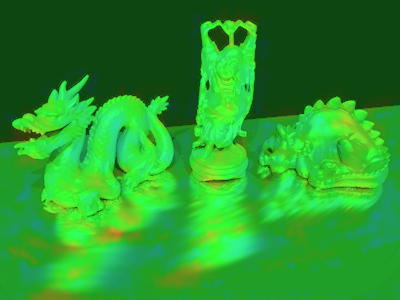
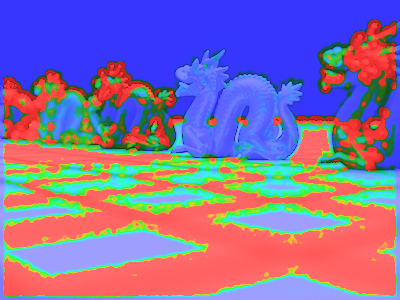
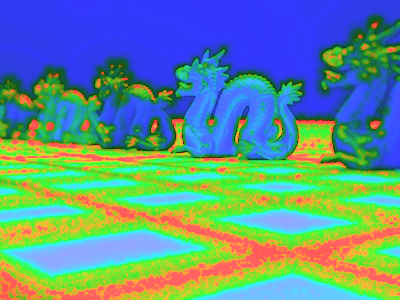
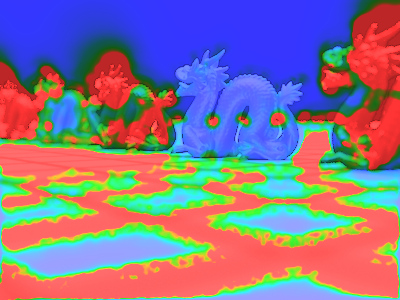
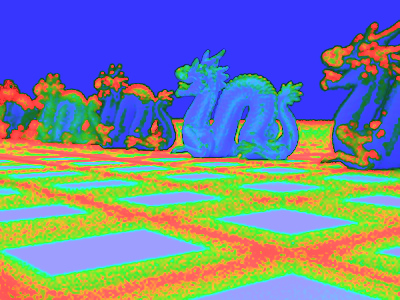
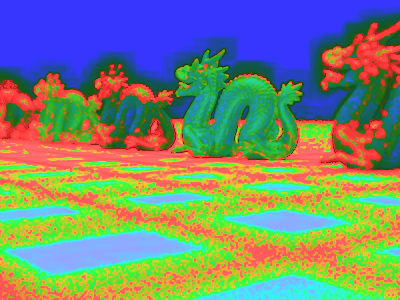
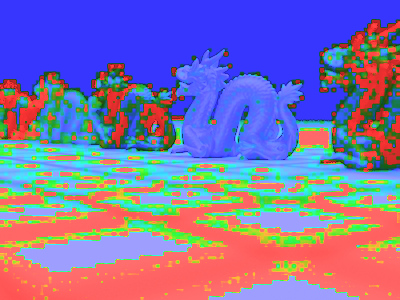
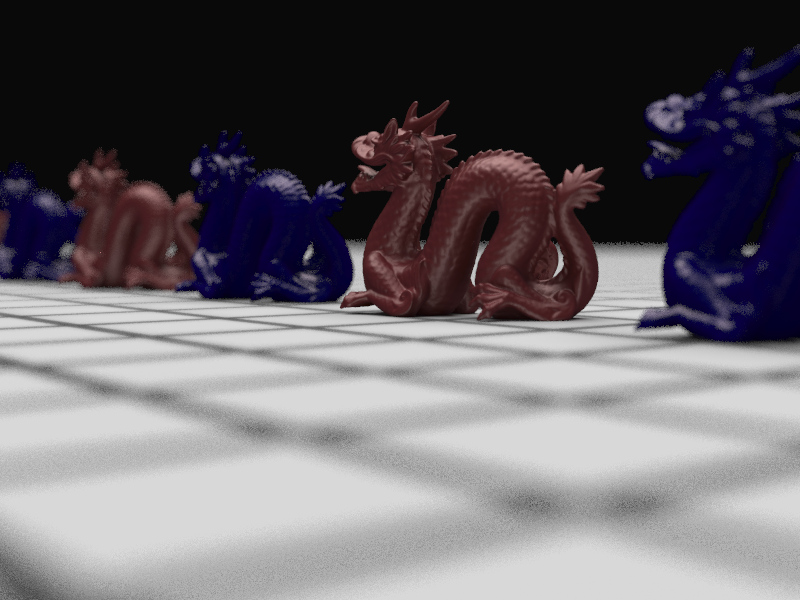 dragons - test image dragons - test image
| With-reference
 | 
 |
| Metric | auc@25 | auc@50 | rho |
|---|
| newMetric | 0.855 | 0.906 | 0.643 |
| SSIM | 0.77 | 0.809 | 0.379 |
| HDR-VDP-2 | 0.809 | 0.842 | 0.486 |
| MS-SSIM | 0.719 | 0.752 | 0.166 |
| AD | 0.739 | 0.77 | 0.302 |
| sCIE-Lab | 0.675 | 0.678 | 0.005 |
| sCorrel | 0.787 | 0.84 | 0.43 |
| NoRM | 0.681 | 0.742 | 0.373 |
|
|
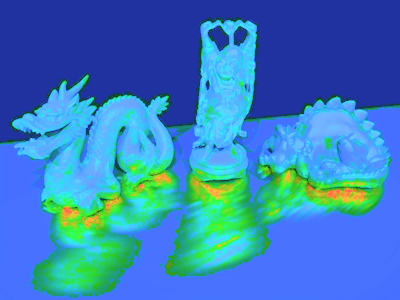
 Mean observer data - with reference experiment Mean observer data - with reference experiment
|
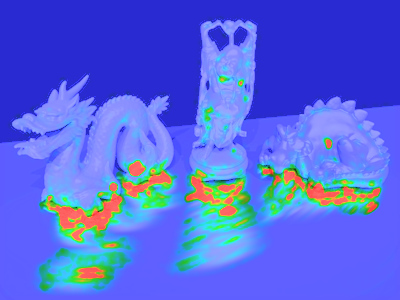
 newMetric - distortion map newMetric - distortion map
|
 SSIM - distortion map SSIM - distortion map
|
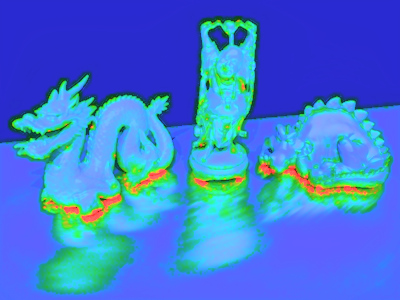
 HDR-VDP-2 - distortion map HDR-VDP-2 - distortion map
|
 MS-SSIM - distortion map MS-SSIM - distortion map
|
 AD - distortion map AD - distortion map
|
 sCIE-Lab - distortion map sCIE-Lab - distortion map
|
 sCorrel - distortion map sCorrel - distortion map
|
 NoRM - distortion map NoRM - distortion map
|
|
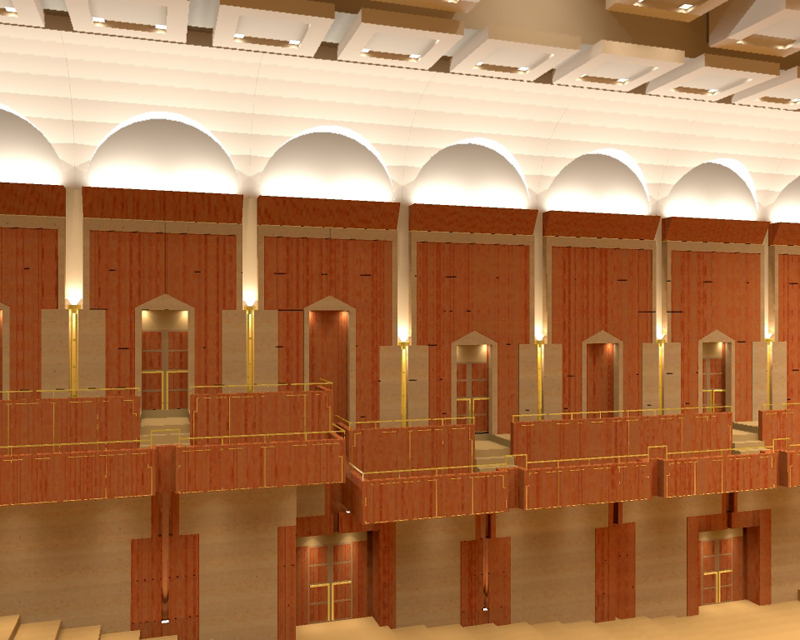 hall - test image hall - test image
| With-reference

 | 
 |
| Metric | auc@25 | auc@50 | rho |
|---|
| newMetric | NaN | NaN | -0.323 |
| SSIM | NaN | NaN | 0.173 |
| HDR-VDP-2 | NaN | NaN | 0.043 |
| MS-SSIM | NaN | NaN | -0.088 |
| AD | NaN | NaN | 0.119 |
| sCIE-Lab | NaN | NaN | 0.04 |
| sCorrel | NaN | NaN | 0.123 |
| NoRM | NaN | NaN | 0.466 |
|
|
 Mean observer data - with reference experiment Mean observer data - with reference experiment
|
 newMetric - distortion map newMetric - distortion map
|
 SSIM - distortion map SSIM - distortion map
|
 HDR-VDP-2 - distortion map HDR-VDP-2 - distortion map
|
 MS-SSIM - distortion map MS-SSIM - distortion map
|
 AD - distortion map AD - distortion map
|
 sCIE-Lab - distortion map sCIE-Lab - distortion map
|
 sCorrel - distortion map sCorrel - distortion map
|
 NoRM - distortion map NoRM - distortion map
|
|
 icido - test image icido - test image
| With-reference
 | 
 |
| Metric | auc@25 | auc@50 | rho |
|---|
| newMetric | 0.931 | 0.946 | 0.407 |
| SSIM | 0.956 | 0.986 | 0.577 |
| HDR-VDP-2 | 0.947 | 0.987 | 0.615 |
| MS-SSIM | 0.943 | 0.964 | 0.426 |
| AD | 0.914 | 0.951 | 0.307 |
| sCIE-Lab | 0.931 | 0.951 | 0.303 |
| sCorrel | 0.909 | 0.941 | 0.281 |
| NoRM | 0.655 | 0.727 | 0.357 |
|
|
 Mean observer data - with reference experiment Mean observer data - with reference experiment
|
 newMetric - distortion map newMetric - distortion map
|
 SSIM - distortion map SSIM - distortion map
|
 HDR-VDP-2 - distortion map HDR-VDP-2 - distortion map
|
 MS-SSIM - distortion map MS-SSIM - distortion map
|
 AD - distortion map AD - distortion map
|
 sCIE-Lab - distortion map sCIE-Lab - distortion map
|
 sCorrel - distortion map sCorrel - distortion map
|
 NoRM - distortion map NoRM - distortion map
|
|
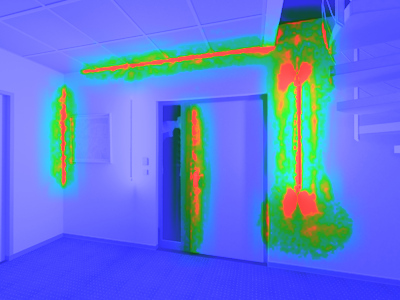
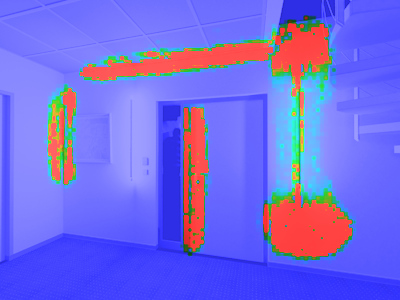
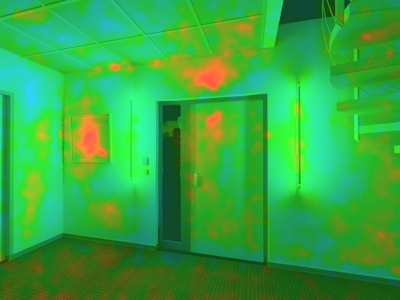
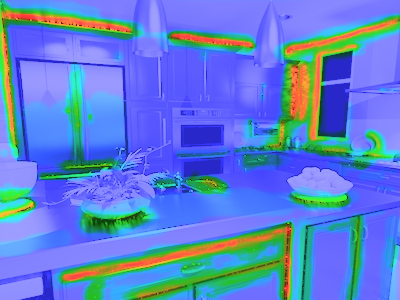
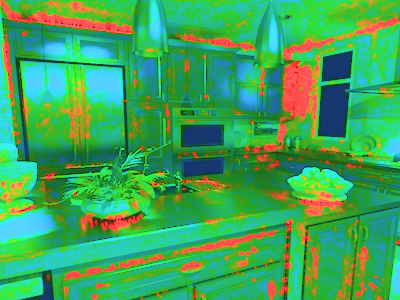
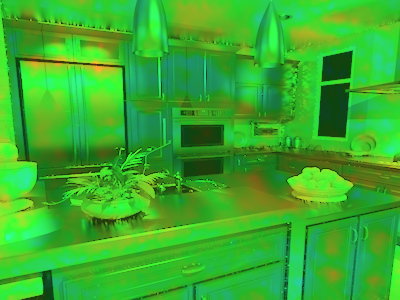
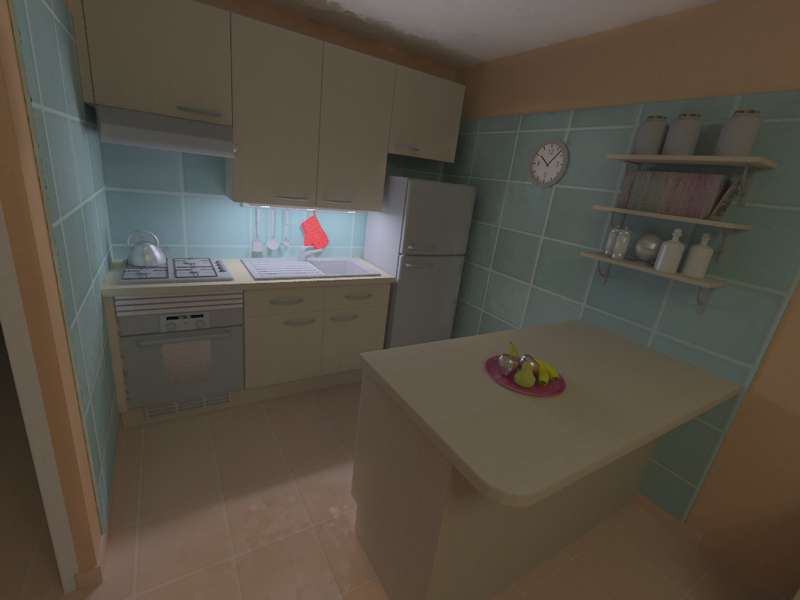
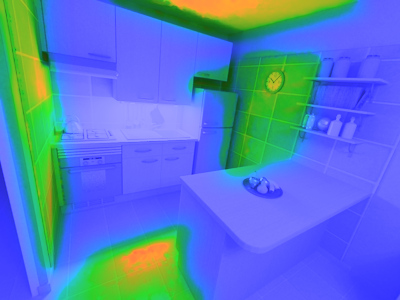
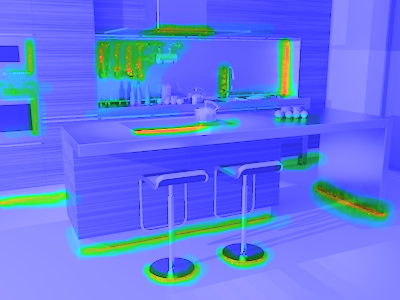
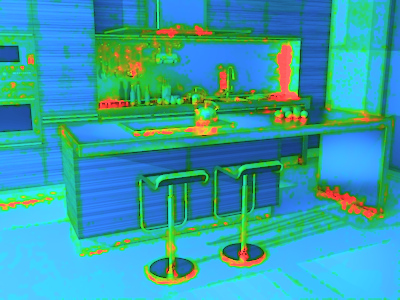
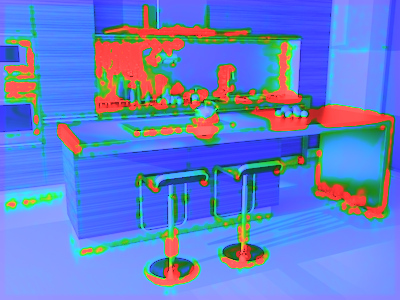
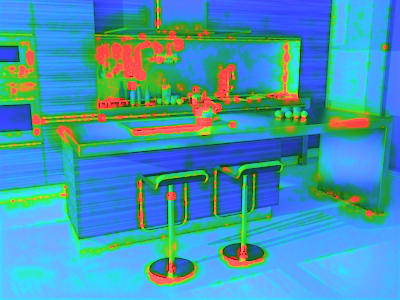
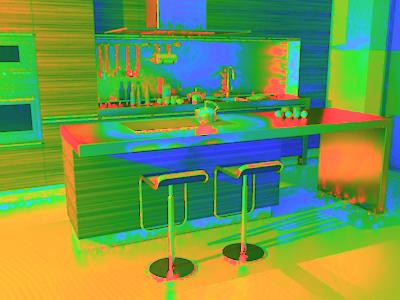
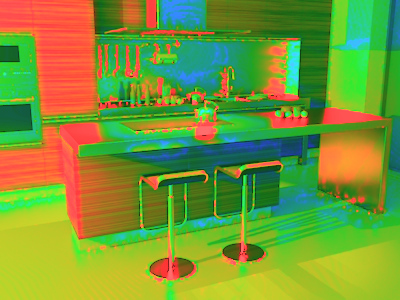
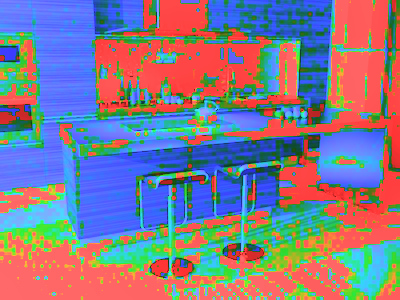
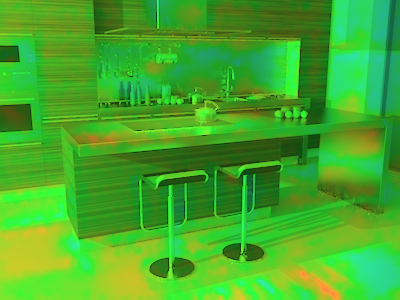
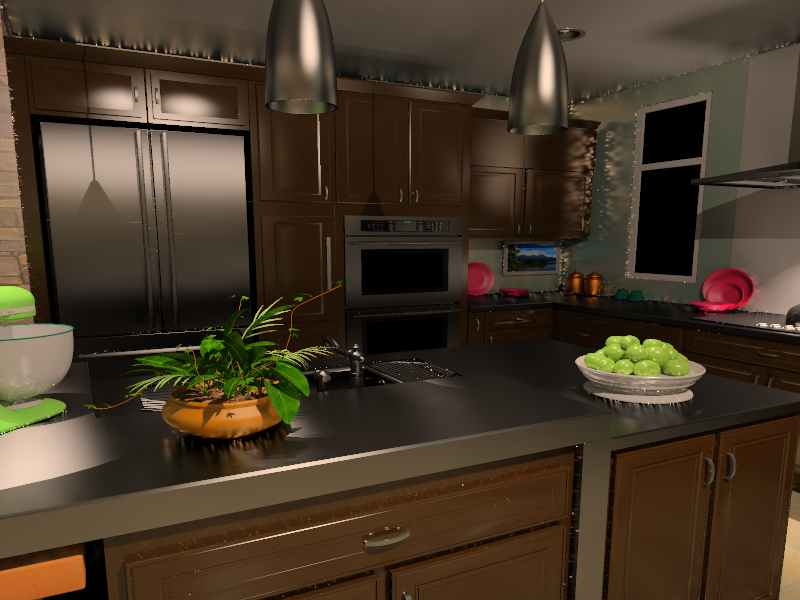 kitchen - test image kitchen - test image
| With-reference
 | 
 |
| Metric | auc@25 | auc@50 | rho |
|---|
| newMetric | 0.754 | 0.829 | 0.375 |
| SSIM | 0.776 | 0.837 | 0.391 |
| HDR-VDP-2 | 0.784 | 0.848 | 0.432 |
| MS-SSIM | 0.796 | 0.824 | 0.363 |
| AD | 0.667 | 0.755 | 0.332 |
| sCIE-Lab | 0.674 | 0.741 | 0.342 |
| sCorrel | 0.544 | 0.588 | 0.021 |
| NoRM | 0.501 | 0.536 | -0.103 |
|
|
 Mean observer data - with reference experiment Mean observer data - with reference experiment
|
 newMetric - distortion map newMetric - distortion map
|
 SSIM - distortion map SSIM - distortion map
|
 HDR-VDP-2 - distortion map HDR-VDP-2 - distortion map
|
 MS-SSIM - distortion map MS-SSIM - distortion map
|
 AD - distortion map AD - distortion map
|
 sCIE-Lab - distortion map sCIE-Lab - distortion map
|
 sCorrel - distortion map sCorrel - distortion map
|
 NoRM - distortion map NoRM - distortion map
|
|
 kitchen_II - test image kitchen_II - test image
| With-reference
 | 
 |
| Metric | auc@25 | auc@50 | rho |
|---|
| newMetric | 0.928 | 0.924 | 0.544 |
| SSIM | 0.885 | 0.887 | 0.4 |
| HDR-VDP-2 | 0.835 | 0.863 | 0.329 |
| MS-SSIM | 0.896 | 0.915 | 0.422 |
| AD | 0.919 | 0.921 | 0.469 |
| sCIE-Lab | 0.934 | 0.938 | 0.551 |
| sCorrel | 0.886 | 0.882 | 0.387 |
| NoRM | 0.587 | 0.59 | 0.171 |
|
|
 Mean observer data - with reference experiment Mean observer data - with reference experiment
|
 newMetric - distortion map newMetric - distortion map
|
 SSIM - distortion map SSIM - distortion map
|
 HDR-VDP-2 - distortion map HDR-VDP-2 - distortion map
|
 MS-SSIM - distortion map MS-SSIM - distortion map
|
 AD - distortion map AD - distortion map
|
 sCIE-Lab - distortion map sCIE-Lab - distortion map
|
 sCorrel - distortion map sCorrel - distortion map
|
 NoRM - distortion map NoRM - distortion map
|
|
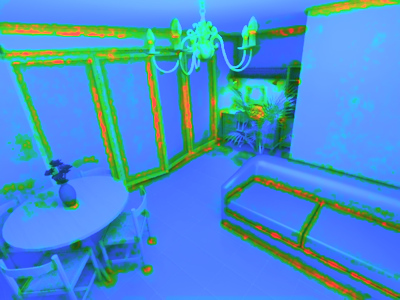
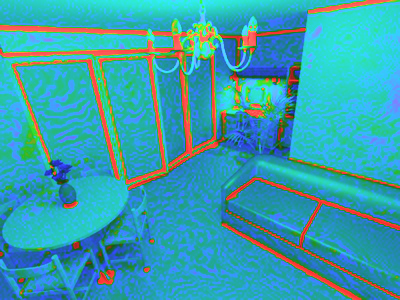
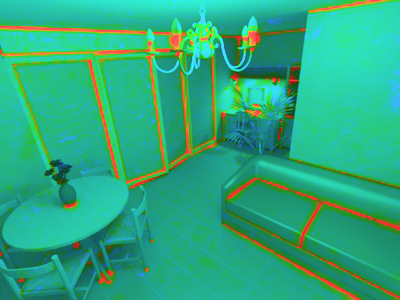
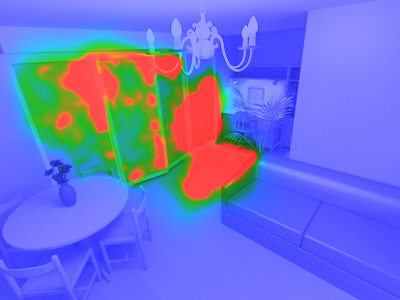
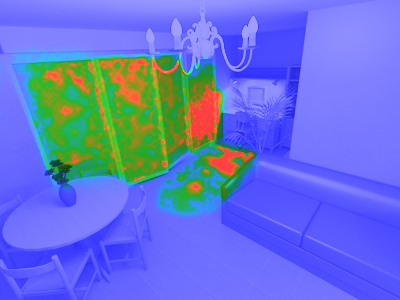
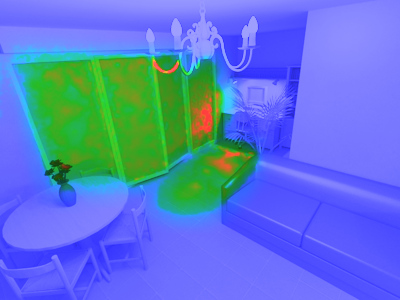
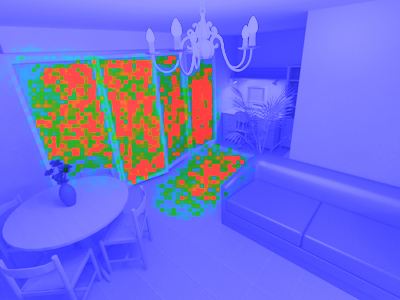
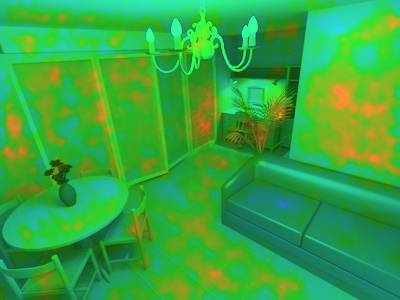
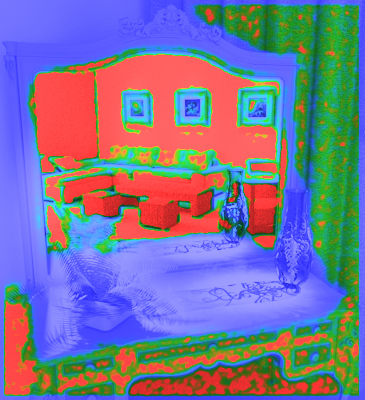
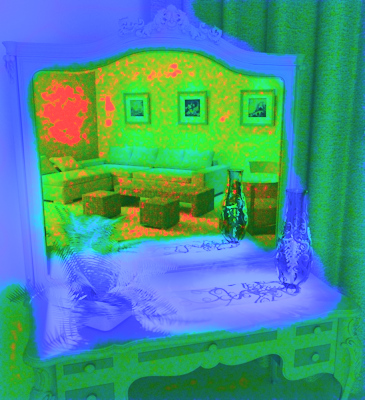
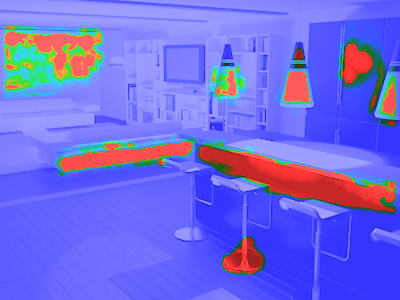
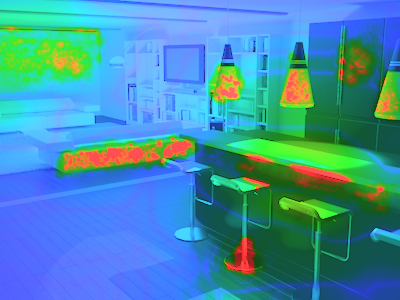
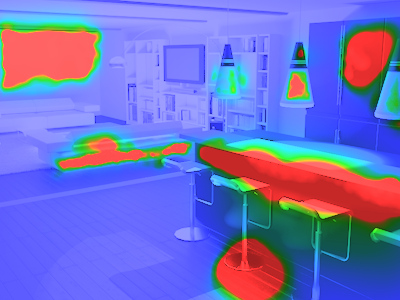
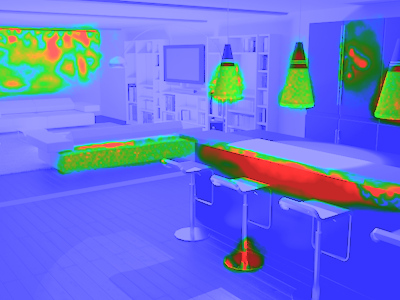
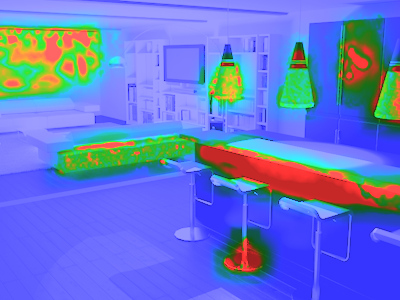
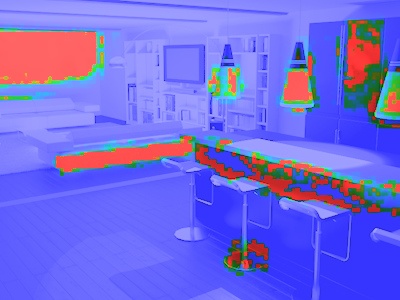
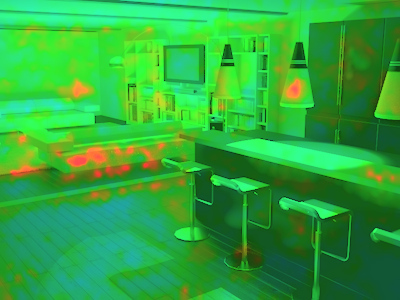
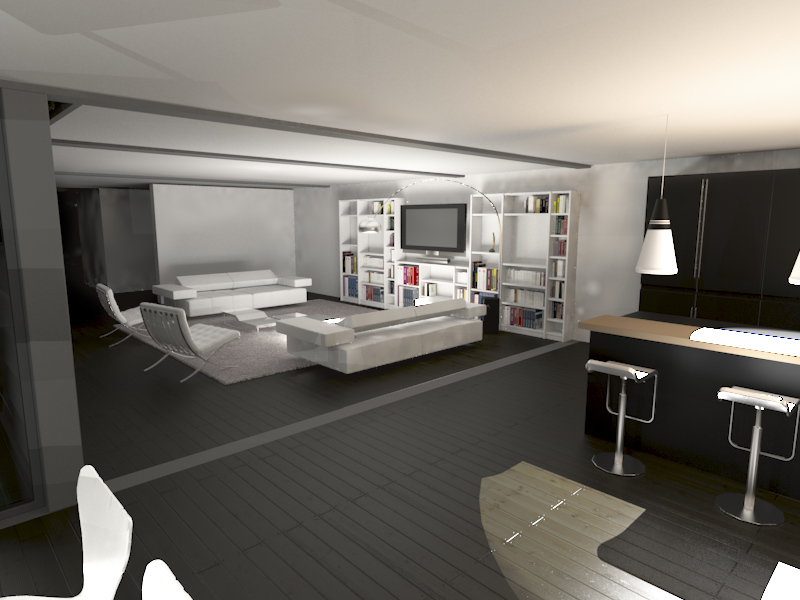
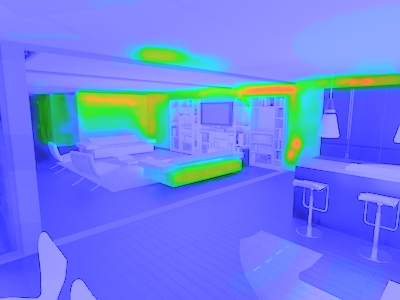
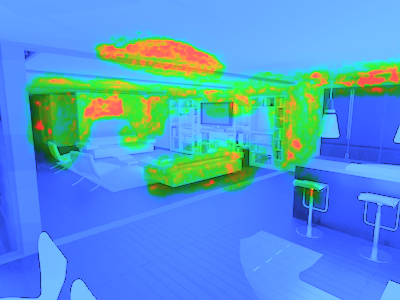
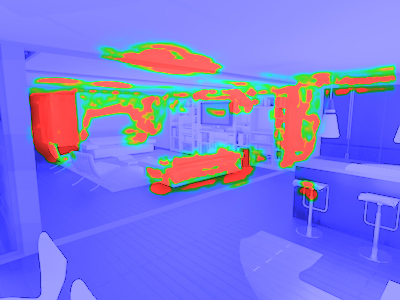
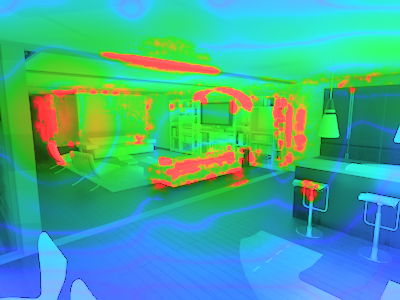
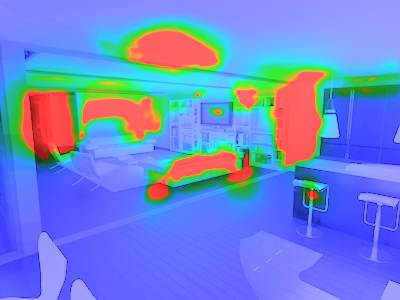
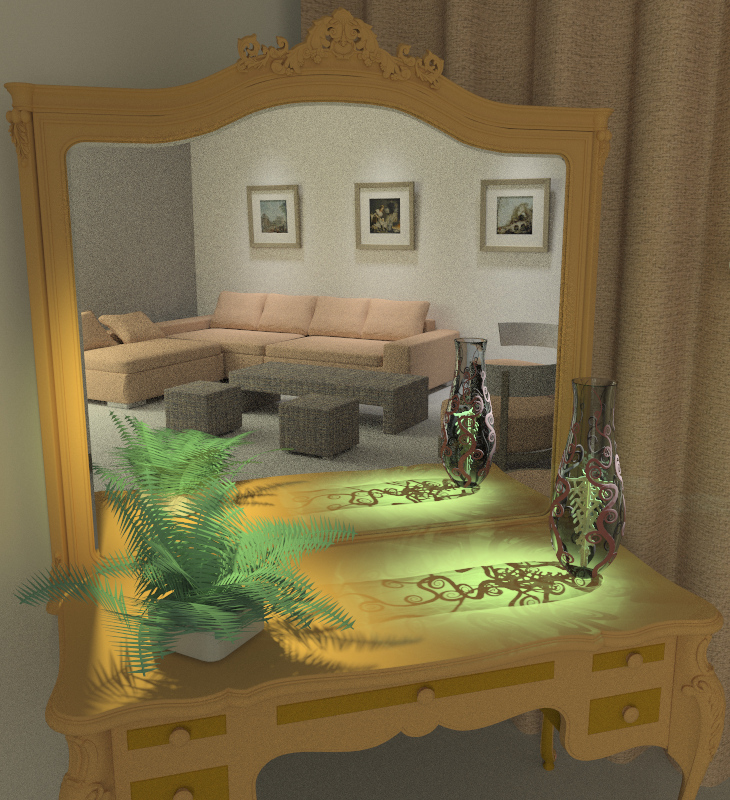 livingroom - test image livingroom - test image
| With-reference
 | 
 |
| Metric | auc@25 | auc@50 | rho |
|---|
| newMetric | 0.872 | 0.84 | 0.543 |
| SSIM | 0.883 | 0.886 | 0.608 |
| HDR-VDP-2 | 0.932 | 0.963 | 0.79 |
| MS-SSIM | 0.903 | 0.909 | 0.68 |
| AD | 0.929 | 0.967 | 0.806 |
| sCIE-Lab | 0.898 | 0.901 | 0.608 |
| sCorrel | 0.916 | 0.818 | 0.392 |
| NoRM | 0.647 | 0.613 | 0.167 |
|
|
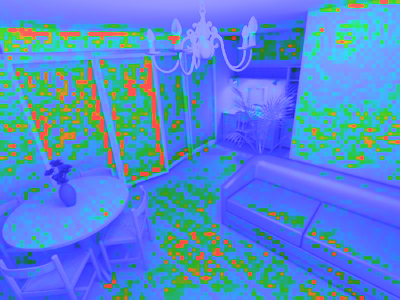
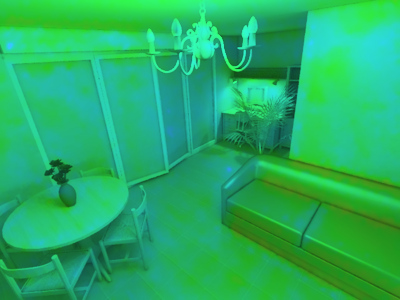
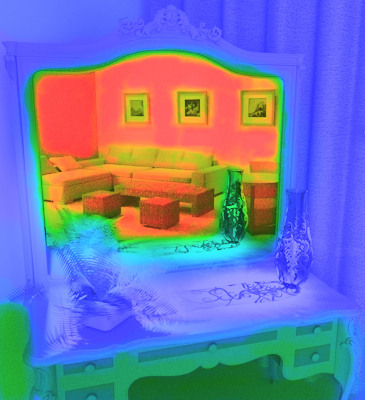 Mean observer data - with reference experiment Mean observer data - with reference experiment
|
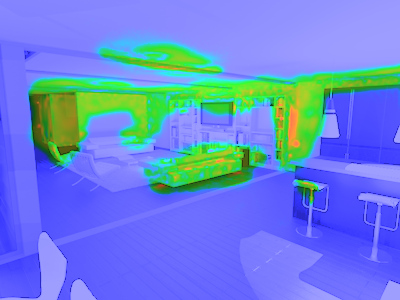
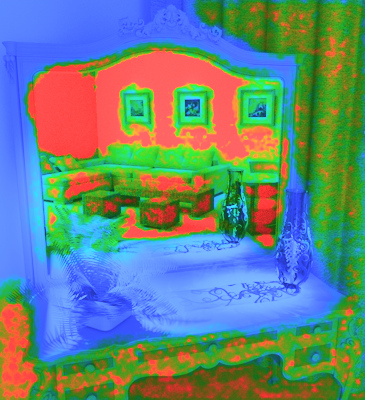 newMetric - distortion map newMetric - distortion map
|
 SSIM - distortion map SSIM - distortion map
|
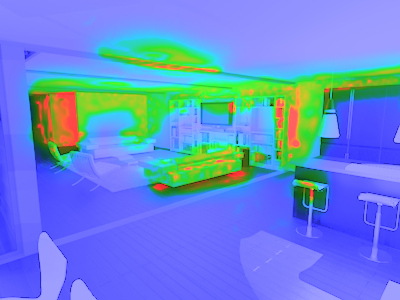
 HDR-VDP-2 - distortion map HDR-VDP-2 - distortion map
|
 MS-SSIM - distortion map MS-SSIM - distortion map
|
 AD - distortion map AD - distortion map
|
 sCIE-Lab - distortion map sCIE-Lab - distortion map
|
 sCorrel - distortion map sCorrel - distortion map
|
 NoRM - distortion map NoRM - distortion map
|
|
 mpii - test image mpii - test image
| With-reference
 | 
 |
| Metric | auc@25 | auc@50 | rho |
|---|
| newMetric | 0.981 | 0.977 | 0.332 |
| SSIM | 0.941 | 0.973 | 0.567 |
| HDR-VDP-2 | 0.985 | 0.975 | 0.404 |
| MS-SSIM | 0.99 | 0.987 | 0.628 |
| AD | 0.985 | 0.983 | 0.601 |
| sCIE-Lab | 0.989 | 0.981 | 0.571 |
| sCorrel | 0.953 | 0.967 | 0.33 |
| NoRM | 0.927 | 0.943 | 0.634 |
|
|
 Mean observer data - with reference experiment Mean observer data - with reference experiment
|
 newMetric - distortion map newMetric - distortion map
|
 SSIM - distortion map SSIM - distortion map
|
 HDR-VDP-2 - distortion map HDR-VDP-2 - distortion map
|
 MS-SSIM - distortion map MS-SSIM - distortion map
|
 AD - distortion map AD - distortion map
|
 sCIE-Lab - distortion map sCIE-Lab - distortion map
|
 sCorrel - distortion map sCorrel - distortion map
|
 NoRM - distortion map NoRM - distortion map
|
|
 plants-d - test image plants-d - test image
| With-reference
 | 
 |
| Metric | auc@25 | auc@50 | rho |
|---|
| newMetric | 0.958 | 0.951 | 0.734 |
| SSIM | 0.895 | 0.928 | 0.679 |
| HDR-VDP-2 | 0.91 | 0.894 | 0.666 |
| MS-SSIM | 0.96 | 0.964 | 0.794 |
| AD | 0.923 | 0.901 | 0.669 |
| sCIE-Lab | 0.912 | 0.885 | 0.643 |
| sCorrel | 0.898 | 0.887 | 0.663 |
| NoRM | 0.951 | 0.956 | 0.574 |
|
|
 Mean observer data - with reference experiment Mean observer data - with reference experiment
|
 newMetric - distortion map newMetric - distortion map
|
 SSIM - distortion map SSIM - distortion map
|
 HDR-VDP-2 - distortion map HDR-VDP-2 - distortion map
|
 MS-SSIM - distortion map MS-SSIM - distortion map
|
 AD - distortion map AD - distortion map
|
 sCIE-Lab - distortion map sCIE-Lab - distortion map
|
 sCorrel - distortion map sCorrel - distortion map
|
 NoRM - distortion map NoRM - distortion map
|
|
 plants-u - test image plants-u - test image
| With-reference
 | 
 |
| Metric | auc@25 | auc@50 | rho |
|---|
| newMetric | 0.943 | 0.941 | 0.665 |
| SSIM | 0.891 | 0.895 | 0.669 |
| HDR-VDP-2 | 0.963 | 0.956 | 0.75 |
| MS-SSIM | 0.949 | 0.964 | 0.82 |
| AD | 0.938 | 0.941 | 0.607 |
| sCIE-Lab | 0.941 | 0.936 | 0.668 |
| sCorrel | 0.928 | 0.924 | 0.626 |
| NoRM | 0.903 | 0.919 | 0.581 |
|
|
 Mean observer data - with reference experiment Mean observer data - with reference experiment
|
 newMetric - distortion map newMetric - distortion map
|
 SSIM - distortion map SSIM - distortion map
|
 HDR-VDP-2 - distortion map HDR-VDP-2 - distortion map
|
 MS-SSIM - distortion map MS-SSIM - distortion map
|
 AD - distortion map AD - distortion map
|
 sCIE-Lab - distortion map sCIE-Lab - distortion map
|
 sCorrel - distortion map sCorrel - distortion map
|
 NoRM - distortion map NoRM - distortion map
|
|
 red kitchen - test image red kitchen - test image
| With-reference
 | 
 |
| Metric | auc@25 | auc@50 | rho |
|---|
| newMetric | 0.9 | 0.934 | 0.511 |
| SSIM | 0.897 | 0.905 | 0.448 |
| HDR-VDP-2 | 0.892 | 0.918 | 0.466 |
| MS-SSIM | 0.772 | 0.766 | 0.165 |
| AD | 0.538 | 0.605 | 0.134 |
| sCIE-Lab | 0.465 | 0.53 | 0.054 |
| sCorrel | 0.696 | 0.707 | 0.276 |
| NoRM | 0.449 | 0.485 | -0.053 |
|
|
 Mean observer data - with reference experiment Mean observer data - with reference experiment
|
 newMetric - distortion map newMetric - distortion map
|
 SSIM - distortion map SSIM - distortion map
|
 HDR-VDP-2 - distortion map HDR-VDP-2 - distortion map
|
 MS-SSIM - distortion map MS-SSIM - distortion map
|
 AD - distortion map AD - distortion map
|
 sCIE-Lab - distortion map sCIE-Lab - distortion map
|
 sCorrel - distortion map sCorrel - distortion map
|
 NoRM - distortion map NoRM - distortion map
|
|
 room - test image room - test image
| With-reference
 | 
 |
| Metric | auc@25 | auc@50 | rho |
|---|
| newMetric | 0.834 | 0.769 | 0.244 |
| SSIM | 0.853 | 0.803 | 0.297 |
| HDR-VDP-2 | 0.804 | 0.695 | 0.175 |
| MS-SSIM | 0.826 | 0.709 | 0.162 |
| AD | 0.827 | 0.77 | 0.184 |
| sCIE-Lab | 0.857 | 0.785 | 0.222 |
| sCorrel | 0.774 | 0.703 | -0.182 |
| NoRM | 0.49 | 0.326 | 0.079 |
|
|
 Mean observer data - with reference experiment Mean observer data - with reference experiment
|
 newMetric - distortion map newMetric - distortion map
|
 SSIM - distortion map SSIM - distortion map
|
 HDR-VDP-2 - distortion map HDR-VDP-2 - distortion map
|
 MS-SSIM - distortion map MS-SSIM - distortion map
|
 AD - distortion map AD - distortion map
|
 sCIE-Lab - distortion map sCIE-Lab - distortion map
|
 sCorrel - distortion map sCorrel - distortion map
|
 NoRM - distortion map NoRM - distortion map
|
|
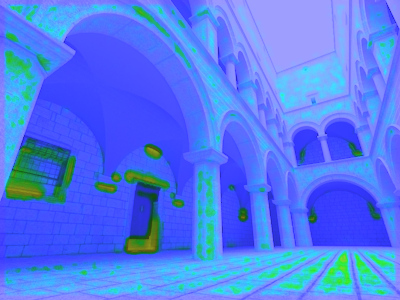
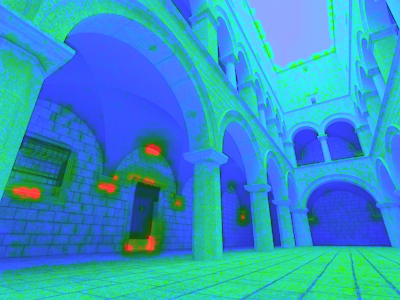
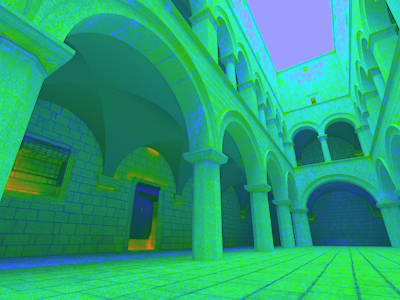
 sala - test image sala - test image
| With-reference
 | 
 |
| Metric | auc@25 | auc@50 | rho |
|---|
| newMetric | 0.763 | 0.707 | 0.376 |
| SSIM | 0.659 | 0.495 | 0.173 |
| HDR-VDP-2 | 0.731 | 0.79 | 0.419 |
| MS-SSIM | 0.763 | 0.687 | 0.388 |
| AD | 0.434 | 0.39 | -0.215 |
| sCIE-Lab | 0.572 | 0.651 | 0.026 |
| sCorrel | 0.818 | 0.896 | 0.556 |
| NoRM | 0.322 | 0.205 | -0.456 |
|
|
 Mean observer data - with reference experiment Mean observer data - with reference experiment
|
 newMetric - distortion map newMetric - distortion map
|
 SSIM - distortion map SSIM - distortion map
|
 HDR-VDP-2 - distortion map HDR-VDP-2 - distortion map
|
 MS-SSIM - distortion map MS-SSIM - distortion map
|
 AD - distortion map AD - distortion map
|
 sCIE-Lab - distortion map sCIE-Lab - distortion map
|
 sCorrel - distortion map sCorrel - distortion map
|
 NoRM - distortion map NoRM - distortion map
|
|
 sanmiguel - test image sanmiguel - test image
| With-reference
 | 
 |
| Metric | auc@25 | auc@50 | rho |
|---|
| newMetric | 0.959 | NaN | 0.461 |
| SSIM | 0.932 | NaN | 0.392 |
| HDR-VDP-2 | 0.942 | NaN | 0.263 |
| MS-SSIM | 0.919 | NaN | 0.068 |
| AD | 0.961 | NaN | 0.393 |
| sCIE-Lab | 0.932 | NaN | 0.192 |
| sCorrel | 0.966 | NaN | 0.478 |
| NoRM | 0.693 | NaN | 0.227 |
|
|
 Mean observer data - with reference experiment Mean observer data - with reference experiment
|
 newMetric - distortion map newMetric - distortion map
|
 SSIM - distortion map SSIM - distortion map
|
 HDR-VDP-2 - distortion map HDR-VDP-2 - distortion map
|
 MS-SSIM - distortion map MS-SSIM - distortion map
|
 AD - distortion map AD - distortion map
|
 sCIE-Lab - distortion map sCIE-Lab - distortion map
|
 sCorrel - distortion map sCorrel - distortion map
|
 NoRM - distortion map NoRM - distortion map
|
|
 sanmiguel_cam3 - test image sanmiguel_cam3 - test image
| With-reference
 | 
 |
| Metric | auc@25 | auc@50 | rho |
|---|
| newMetric | 0.982 | 0.976 | 0.608 |
| SSIM | 0.9 | 0.896 | 0.524 |
| HDR-VDP-2 | 0.972 | 0.981 | 0.582 |
| MS-SSIM | 0.994 | 0.994 | 0.752 |
| AD | 0.975 | 0.977 | 0.661 |
| sCIE-Lab | 0.99 | 0.988 | 0.723 |
| sCorrel | 0.981 | 0.983 | 0.625 |
| NoRM | 0.552 | 0.549 | 0.118 |
|
|
 Mean observer data - with reference experiment Mean observer data - with reference experiment
|
 newMetric - distortion map newMetric - distortion map
|
 SSIM - distortion map SSIM - distortion map
|
 HDR-VDP-2 - distortion map HDR-VDP-2 - distortion map
|
 MS-SSIM - distortion map MS-SSIM - distortion map
|
 AD - distortion map AD - distortion map
|
 sCIE-Lab - distortion map sCIE-Lab - distortion map
|
 sCorrel - distortion map sCorrel - distortion map
|
 NoRM - distortion map NoRM - distortion map
|
|
 sanmiguel_cam4 - test image sanmiguel_cam4 - test image
| With-reference
 | 
 |
| Metric | auc@25 | auc@50 | rho |
|---|
| newMetric | 0.906 | 0.956 | 0.597 |
| SSIM | 0.801 | 0.797 | 0.236 |
| HDR-VDP-2 | 0.742 | 0.75 | 0.184 |
| MS-SSIM | 0.804 | 0.814 | 0.241 |
| AD | 0.781 | 0.774 | 0.179 |
| sCIE-Lab | 0.781 | 0.777 | 0.188 |
| sCorrel | 0.908 | 0.946 | 0.589 |
| NoRM | 0.691 | 0.751 | 0.305 |
|
|
 Mean observer data - with reference experiment Mean observer data - with reference experiment
|
 newMetric - distortion map newMetric - distortion map
|
 SSIM - distortion map SSIM - distortion map
|
 HDR-VDP-2 - distortion map HDR-VDP-2 - distortion map
|
 MS-SSIM - distortion map MS-SSIM - distortion map
|
 AD - distortion map AD - distortion map
|
 sCIE-Lab - distortion map sCIE-Lab - distortion map
|
 sCorrel - distortion map sCorrel - distortion map
|
 NoRM - distortion map NoRM - distortion map
|
|
 sponza - test image sponza - test image
| With-reference
 | 
 |
| Metric | auc@25 | auc@50 | rho |
|---|
| newMetric | 0.951 | 0.985 | 0.624 |
| SSIM | 0.93 | 0.988 | 0.621 |
| HDR-VDP-2 | 0.921 | 0.97 | 0.576 |
| MS-SSIM | 0.976 | 0.99 | 0.675 |
| AD | 0.868 | 0.964 | 0.522 |
| sCIE-Lab | 0.948 | 0.989 | 0.661 |
| sCorrel | 0.775 | 0.886 | 0.383 |
| NoRM | 0.574 | 0.499 | -0.058 |
|
|
 Mean observer data - with reference experiment Mean observer data - with reference experiment
|
 newMetric - distortion map newMetric - distortion map
|
 SSIM - distortion map SSIM - distortion map
|
 HDR-VDP-2 - distortion map HDR-VDP-2 - distortion map
|
 MS-SSIM - distortion map MS-SSIM - distortion map
|
 AD - distortion map AD - distortion map
|
 sCIE-Lab - distortion map sCIE-Lab - distortion map
|
 sCorrel - distortion map sCorrel - distortion map
|
 NoRM - distortion map NoRM - distortion map
|
|
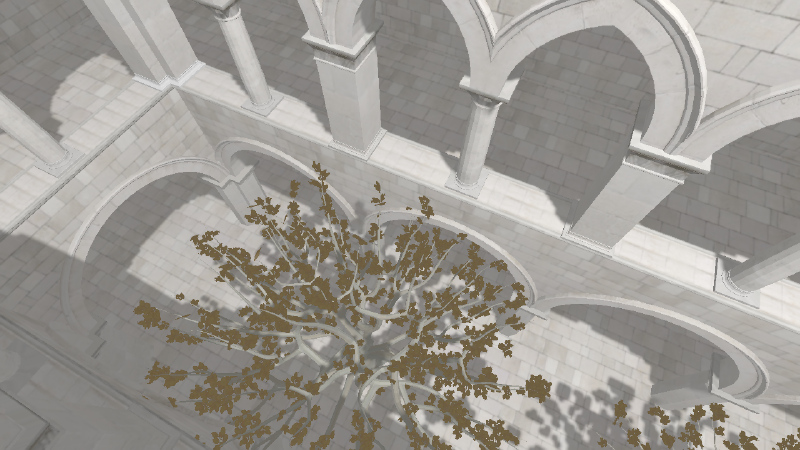
 sponza above tree - test image sponza above tree - test image
| With-reference
 | 
 |
| Metric | auc@25 | auc@50 | rho |
|---|
| newMetric | 0.988 | 0.975 | 0.661 |
| SSIM | 0.973 | 0.953 | 0.491 |
| HDR-VDP-2 | 0.971 | 0.943 | 0.376 |
| MS-SSIM | 0.956 | 0.943 | 0.417 |
| AD | 0.882 | 0.896 | 0.497 |
| sCIE-Lab | 0.976 | 0.962 | 0.583 |
| sCorrel | 0.874 | 0.88 | 0.429 |
| NoRM | 0.703 | 0.733 | 0.182 |
|
|
 Mean observer data - with reference experiment Mean observer data - with reference experiment
|
 newMetric - distortion map newMetric - distortion map
|
 SSIM - distortion map SSIM - distortion map
|
 HDR-VDP-2 - distortion map HDR-VDP-2 - distortion map
|
 MS-SSIM - distortion map MS-SSIM - distortion map
|
 AD - distortion map AD - distortion map
|
 sCIE-Lab - distortion map sCIE-Lab - distortion map
|
 sCorrel - distortion map sCorrel - distortion map
|
 NoRM - distortion map NoRM - distortion map
|
|
 sponza arches - test image sponza arches - test image
| With-reference
 | 
 |
| Metric | auc@25 | auc@50 | rho |
|---|
| newMetric | 0.883 | 0.93 | 0.49 |
| SSIM | 0.847 | 0.898 | 0.389 |
| HDR-VDP-2 | 0.845 | 0.877 | 0.405 |
| MS-SSIM | 0.844 | 0.863 | 0.243 |
| AD | 0.719 | 0.808 | 0.255 |
| sCIE-Lab | 0.839 | 0.883 | 0.337 |
| sCorrel | 0.737 | 0.81 | 0.23 |
| NoRM | 0.6 | 0.606 | 0.248 |
|
|
 Mean observer data - with reference experiment Mean observer data - with reference experiment
|
 newMetric - distortion map newMetric - distortion map
|
 SSIM - distortion map SSIM - distortion map
|
 HDR-VDP-2 - distortion map HDR-VDP-2 - distortion map
|
 MS-SSIM - distortion map MS-SSIM - distortion map
|
 AD - distortion map AD - distortion map
|
 sCIE-Lab - distortion map sCIE-Lab - distortion map
|
 sCorrel - distortion map sCorrel - distortion map
|
 NoRM - distortion map NoRM - distortion map
|
|
 sponza atrium - test image sponza atrium - test image
| With-reference
 | 
 |
| Metric | auc@25 | auc@50 | rho |
|---|
| newMetric | 0.964 | 0.98 | 0.667 |
| SSIM | 0.949 | 0.961 | 0.603 |
| HDR-VDP-2 | 0.968 | 0.966 | 0.451 |
| MS-SSIM | 0.946 | 0.943 | 0.316 |
| AD | 0.799 | 0.88 | 0.48 |
| sCIE-Lab | 0.971 | 0.977 | 0.624 |
| sCorrel | 0.782 | 0.851 | 0.44 |
| NoRM | 0.812 | 0.791 | 0.173 |
|
|
 Mean observer data - with reference experiment Mean observer data - with reference experiment
|
 newMetric - distortion map newMetric - distortion map
|
 SSIM - distortion map SSIM - distortion map
|
 HDR-VDP-2 - distortion map HDR-VDP-2 - distortion map
|
 MS-SSIM - distortion map MS-SSIM - distortion map
|
 AD - distortion map AD - distortion map
|
 sCIE-Lab - distortion map sCIE-Lab - distortion map
|
 sCorrel - distortion map sCorrel - distortion map
|
 NoRM - distortion map NoRM - distortion map
|
|
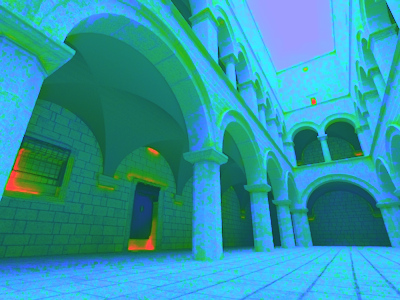
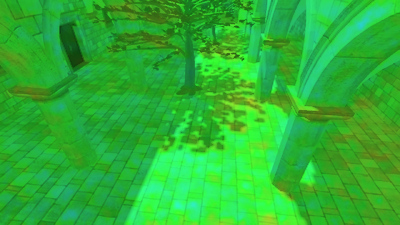
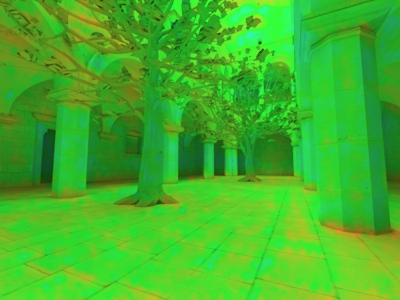
 sponza tree shadows - test image sponza tree shadows - test image
| With-reference
 | 
 |
| Metric | auc@25 | auc@50 | rho |
|---|
| newMetric | 0.953 | 0.937 | 0.557 |
| SSIM | 0.9 | 0.915 | 0.445 |
| HDR-VDP-2 | 0.938 | 0.906 | 0.382 |
| MS-SSIM | 0.938 | 0.884 | 0.28 |
| AD | 0.793 | 0.827 | 0.435 |
| sCIE-Lab | 0.929 | 0.914 | 0.505 |
| sCorrel | 0.818 | 0.822 | 0.343 |
| NoRM | 0.754 | 0.665 | 0.004 |
|
|
 Mean observer data - with reference experiment Mean observer data - with reference experiment
|
 newMetric - distortion map newMetric - distortion map
|
 SSIM - distortion map SSIM - distortion map
|
 HDR-VDP-2 - distortion map HDR-VDP-2 - distortion map
|
 MS-SSIM - distortion map MS-SSIM - distortion map
|
 AD - distortion map AD - distortion map
|
 sCIE-Lab - distortion map sCIE-Lab - distortion map
|
 sCorrel - distortion map sCorrel - distortion map
|
 NoRM - distortion map NoRM - distortion map
|
|
 sponza trees - test image sponza trees - test image
| With-reference
 | 
 |
| Metric | auc@25 | auc@50 | rho |
|---|
| newMetric | 0.885 | 0.859 | 0.519 |
| SSIM | 0.988 | 0.993 | 0.592 |
| HDR-VDP-2 | 0.976 | 0.981 | 0.577 |
| MS-SSIM | 0.963 | 0.983 | 0.532 |
| AD | 0.948 | 0.995 | 0.498 |
| sCIE-Lab | 0.966 | 0.995 | 0.534 |
| sCorrel | 0.809 | 0.815 | 0.428 |
| NoRM | 0.911 | 0.959 | 0.425 |
|
|
 Mean observer data - with reference experiment Mean observer data - with reference experiment
|
 newMetric - distortion map newMetric - distortion map
|
 SSIM - distortion map SSIM - distortion map
|
 HDR-VDP-2 - distortion map HDR-VDP-2 - distortion map
|
 MS-SSIM - distortion map MS-SSIM - distortion map
|
 AD - distortion map AD - distortion map
|
 sCIE-Lab - distortion map sCIE-Lab - distortion map
|
 sCorrel - distortion map sCorrel - distortion map
|
 NoRM - distortion map NoRM - distortion map
|
|
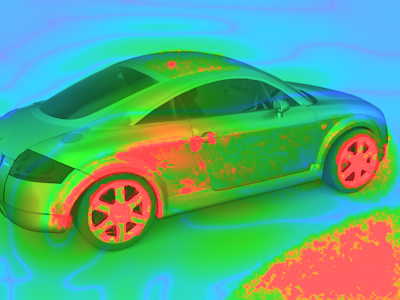
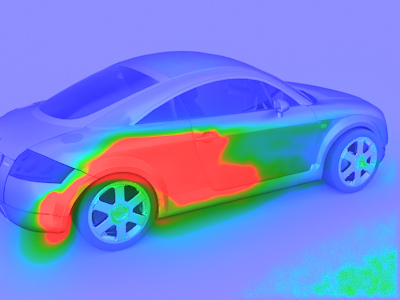
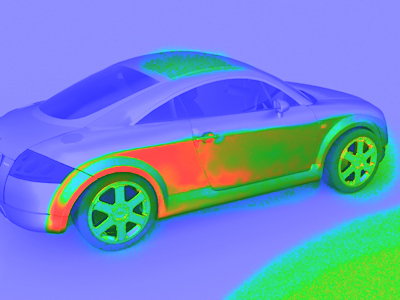
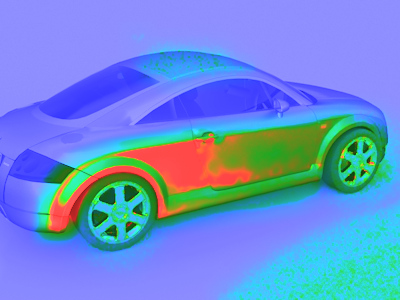
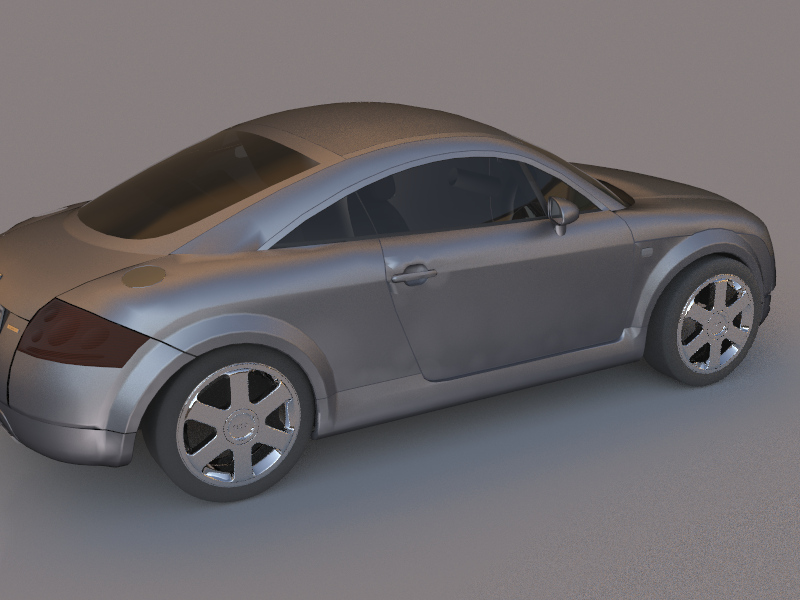 tt - test image tt - test image
| With-reference
 | 
 |
| Metric | auc@25 | auc@50 | rho |
|---|
| newMetric | 0.925 | 0.854 | 0.392 |
| SSIM | 0.899 | 0.868 | 0.428 |
| HDR-VDP-2 | 0.893 | 0.758 | 0.462 |
| MS-SSIM | 0.796 | 0.918 | 0.27 |
| AD | 0.91 | 0.928 | 0.44 |
| sCIE-Lab | 0.862 | 0.934 | 0.262 |
| sCorrel | 0.915 | 0.816 | 0.32 |
| NoRM | 0.699 | 0.595 | 0.324 |
|
|
 Mean observer data - with reference experiment Mean observer data - with reference experiment
|
 newMetric - distortion map newMetric - distortion map
|
 SSIM - distortion map SSIM - distortion map
|
 HDR-VDP-2 - distortion map HDR-VDP-2 - distortion map
|
 MS-SSIM - distortion map MS-SSIM - distortion map
|
 AD - distortion map AD - distortion map
|
 sCIE-Lab - distortion map sCIE-Lab - distortion map
|
 sCorrel - distortion map sCorrel - distortion map
|
 NoRM - distortion map NoRM - distortion map
|
|
 villa_cam1 - test image villa_cam1 - test image
| With-reference
 | 
 |
| Metric | auc@25 | auc@50 | rho |
|---|
| newMetric | 0.972 | 0.965 | 0.64 |
| SSIM | 0.953 | 0.947 | 0.577 |
| HDR-VDP-2 | 0.94 | 0.941 | 0.601 |
| MS-SSIM | 0.901 | 0.901 | 0.428 |
| AD | 0.967 | 0.952 | 0.5 |
| sCIE-Lab | 0.955 | 0.935 | 0.389 |
| sCorrel | 0.942 | 0.953 | 0.619 |
| NoRM | 0.794 | 0.806 | 0.282 |
|
|
 Mean observer data - with reference experiment Mean observer data - with reference experiment
|
 newMetric - distortion map newMetric - distortion map
|
 SSIM - distortion map SSIM - distortion map
|
 HDR-VDP-2 - distortion map HDR-VDP-2 - distortion map
|
 MS-SSIM - distortion map MS-SSIM - distortion map
|
 AD - distortion map AD - distortion map
|
 sCIE-Lab - distortion map sCIE-Lab - distortion map
|
 sCorrel - distortion map sCorrel - distortion map
|
 NoRM - distortion map NoRM - distortion map
|
|
 villa_cam3 - test image villa_cam3 - test image
| With-reference
 | 
 |
| Metric | auc@25 | auc@50 | rho |
|---|
| newMetric | 0.945 | 0.939 | 0.336 |
| SSIM | 0.943 | 0.924 | 0.267 |
| HDR-VDP-2 | 0.902 | 0.876 | 0.166 |
| MS-SSIM | 0.935 | 0.908 | 0.288 |
| AD | 0.946 | 0.938 | 0.362 |
| sCIE-Lab | 0.949 | 0.932 | 0.329 |
| sCorrel | 0.942 | 0.947 | 0.431 |
| NoRM | 0.812 | 0.784 | 0.244 |
|
|
 Mean observer data - with reference experiment Mean observer data - with reference experiment
|
 newMetric - distortion map newMetric - distortion map
|
 SSIM - distortion map SSIM - distortion map
|
 HDR-VDP-2 - distortion map HDR-VDP-2 - distortion map
|
 MS-SSIM - distortion map MS-SSIM - distortion map
|
 AD - distortion map AD - distortion map
|
 sCIE-Lab - distortion map sCIE-Lab - distortion map
|
 sCorrel - distortion map sCorrel - distortion map
|
 NoRM - distortion map NoRM - distortion map
|
|