
A Model of Local Adaptation
ACM Transactions on Graphics (Proceedings of ACM SIGGRAPH Asia 2015)
A Model of Local Adaptation
Peter Vangorp1,2
Karol Myszkowski2
Erich W. Graf3
Rafał K. Mantiuk1,4
1Bangor University, UK
2MPI Informatik, Germany
3University of Southampton, UK
4University of Cambridge, UK
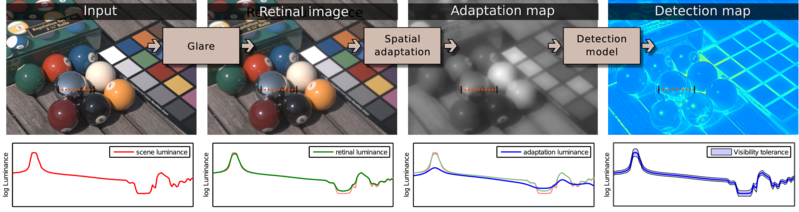
Processing steps of our spatial adaptation model. First, optical glare is simulated to produce a retinal image. Then, the local luminance adaptation map is computed using our novel adaptation model. The plots below show the luminance profile for the pixels marked with the dashed-orange line. Note that the eye cannot adapt to small highlights as shown by the flattened blue curve in the "adaptation luminance" plot. As one of the applications, the adaptation map can be used to estimate the smallest visible contrast in complex images (detection map) and therefore represents a visibility tolerance for each pixel.
Abstract
The visual system constantly adapts to different luminance levels when viewing natural scenes. The state of visual adaptation is the key parameter in many visual models. While the time-course of such adaptation is well understood, there is little known about the spatial pooling that drives the adaptation signal. In this work we propose a new empirical model of local adaptation, that predicts how the adaptation signal is integrated in the retina. The model is based on psychophysical measurements on a high dynamic range (HDR) display. We employ a novel approach to model discovery, in which the experimental stimuli are optimized to find the most predictive model. The model can be used to predict the steady state of adaptation, but also conservative estimates of the visibility (detection) thresholds in complex images. We demonstrate the utility of the model in several applications, such as perceptual error bounds for physically based rendering, determining the backlight resolution for HDR displays, measuring the maximum visible dynamic range in natural scenes, simulation of afterimages, and gaze-dependent tone mapping.
Video
Downloads
|
Applications
Error bounds for physically based rendering

(a) Basic path tracing with adaptive sampling using our detection model as a convergence threshold. Unconverged pixels are marked in red in the inset sample density map. When shown on an HDR display, glare (simulated in the bottom row) will cover most of the noise around bright light sources and highlights. Local adaptation (not simulated) will hide any remaining noise. (b) Equal-time comparison with non-adaptive sampling. (c) Typical adaptive sampling with a constant Weber fraction criterion.
Optimal HDR display background resolution
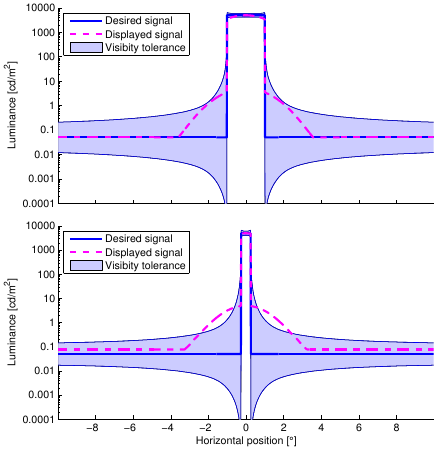
The visibility of distortions on an HDR display caused by limited backlight resolution. The desired signal is a white square of 5000 cd/m2 on a background of 0.05 cd/m2. The plot shows a luminance profile of such a square as desired (solid blue line) and the one that is actually displayed due to limited resolution of the backlight (dashed magenta line). The backlight blur has a Gaussian profile with standard deviation 1° (the result depends on the viewing distance). The visibility bounds predicted by our model (blue) indicate that the display distortions are invisible when the square has a width of 2° (top) but they become visible when the square size is reduced to 0.5° (bottom).
Visible vs. physical dynamic range
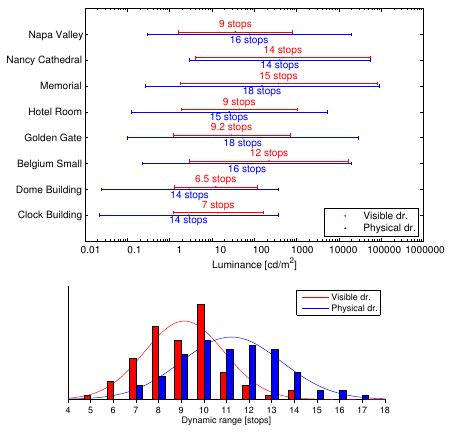
Comparison of physical and visible dynamic range for (top) a few selected scenes and for (bottom) a collection of 76 images from the Southampton-York Natural Scenes (SYNS) dataset.
Simulation of afterimages
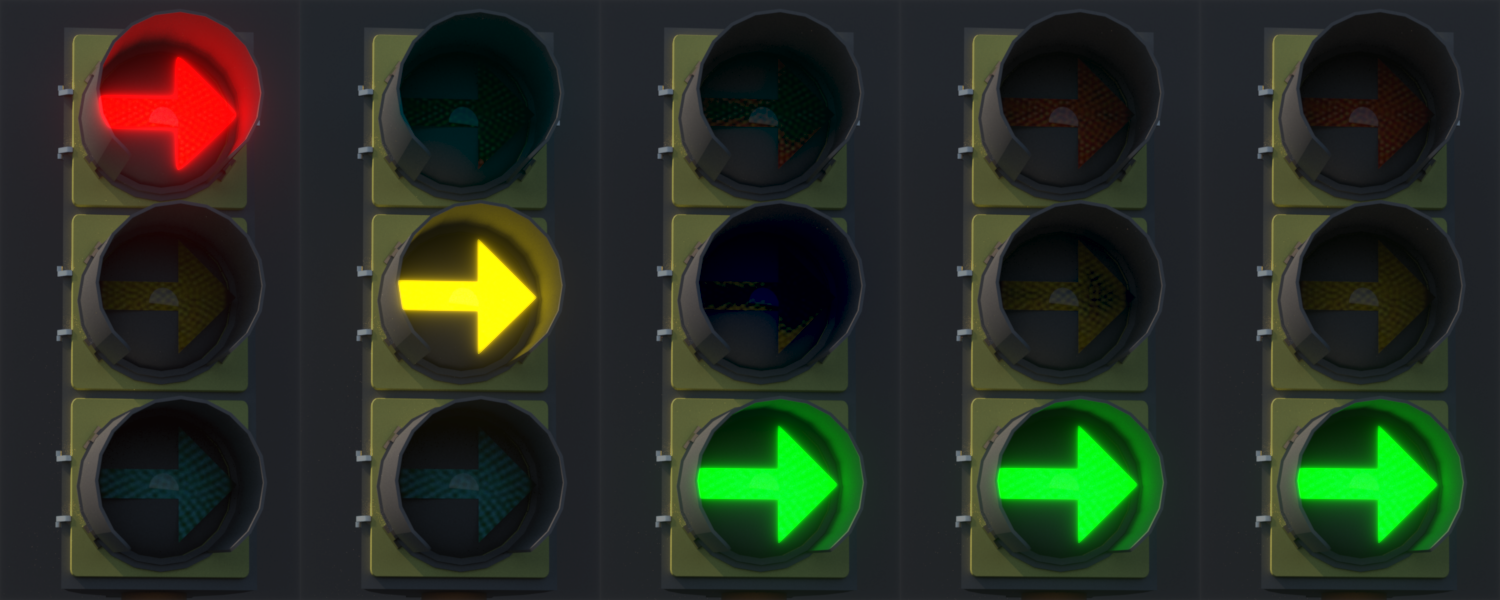
Simulation of afterimages of traffic lights. The red light leaves a greenish afterimage, and the amber light leaves a bluish afterimage. Both afterimages last for a long time while the green light is active.

Simulation of an afterimage illusion. The original image (a) is decomposed into the equiluminant inverse-chromatic image (b) and the luminance image (c). Stare at a point on (b) for at least 10 seconds, then look at the same point on (c). The chromatic information in the afterimage recombined with the luminance resembles the original image (a). Our model correctly predicts (d) the loss of chromatic saturation in this illusion. (For optimal results, try this on a standard sRGB display at a viewing distance of 8 image heights.)
Gaze-dependent tone mapping

Two frames from a session with gaze-dependent tone mapping, in which an observer shifted their gaze from a dark to a bright image region. The map in the middle shows the spatial adaptation map predicted by our model. The circles with numbers show corresponding gaze positions.
Citations
Peter Vangorp, Karol Myszkowski, Erich W. Graf, Rafał K. Mantiuk
A Model of Local Adaptation
ACM Transactions on Graphics (Proceedings of ACM SIGGRAPH Asia 2015).
@article{Vangorp:2015:LocalAdaptationSIGAsia,
  author = {Peter Vangorp and Karol Myszkowski and Erich W. Graf and Rafa\l\ K. Mantiuk},
  title = {A Model of Local Adaptation},
  journal = {ACM Transactions on Graphics (Proceedings of ACM SIGGRAPH Asia 2015)},
  year = {2015},
  volume = {34},
  number = {6},
  pages = {166:1--13},
}
© ACM, 2015. This is the author's version of the work. It is posted here for your personal use. Not for redistribution. The definitive version was published in ACM Transactions on Graphics (Proceedings of ACM SIGGRAPH Asia 2015), http://dx.doi.org/10.1145/2816795.2818086
Copyright is held by ACM. Abstracting with credit is permitted. To copy otherwise, or republish, to post on servers or to redistribute to lists, requires prior specific permission and/or a fee. Request permissions from Permissions@acm.org.
Parts of this work were also presented as an abstract at the European Conference on Visual Perception 2015:
Peter Vangorp, Karol Myszkowski, Erich W. Graf, Rafał K. Mantiuk
An Empirical Model for Local Luminance Adaptation in the Fovea [abstract]
Perception 44, ECVP 2015 Abstract Supplement.