Luminaires |
The following is a complete presentation of the luminaires used for the production of this scene. All lighting data was provided by the luminaire maker Matsushita Electric.
The real Atrium has four different types of lights, we chose to use only two. Accurate measurement data was not available for the small decorative lights, and we ignored the remaining lights which are only seldom used in the real atrium anyway.
Principal Lights
Ref: NC72584
This light has two bulbs; a 250W multi-halogen Ref: MF250-L/BU-P and
a 250W hicalite Ref: K-HICA250-F.G
The total flux of this light is 18000 lm + 10000 lm.
There are 12 lights of this type in the atrium, which are its main
source of illumination. The manufacturer suggested maintenance factor
falls into the range between 63%-100% depending on their exploitation period
and condition. In our simulation, we used point lights with the maintenance
factor changing from 62% to 100%. We obtained those maintenance factor
values as the result of our calibration procedure which was applied in
respect to the luminaires installed in the atrium. We assumed a value
of 100% for one luminaire in which we put new light bulbs. Two luminaires
were turned off two allow a greater diversity of lighting condition. The
luminaire with a 62% maintenance factor is switched on every night, the
other light sources are used on rare occasions.
 |
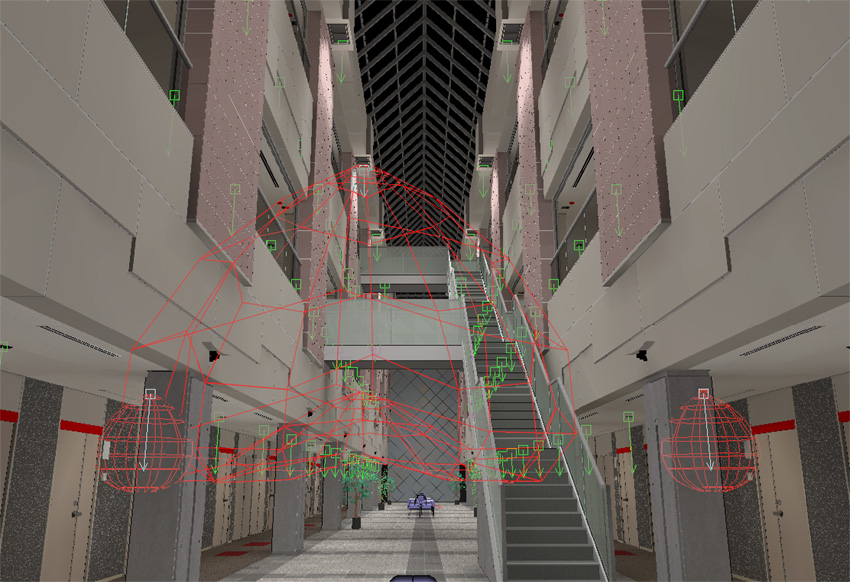
| Maintenance factor illustration for the principal luminaires in the atrium. |
Corridor Lights
Ref: HLA1271T
The light bulb Ref: FDL-27EX-L has a power of 27W and a given total
flux of 355 lm.
The manufacturer suggested maintenance factor falls into the range
between 55%-100%.
We modeled this luminaire as a point light with the maintenance factor
of 75%. We assumed the same maintenance factor value for all luminaires
of this type based on the result of our calibration procedure.
Goniometric Diagram
 |
A typical point light emits in every direction
and has uniform radiation. In our case, the lights have to imitate a complete
lamp with the bulb placed in the reflecting metallic bell shaped support
which direct the light radiation.
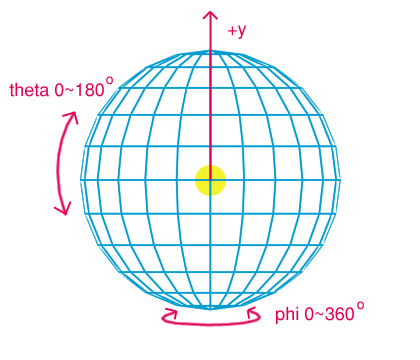
The use of goniometric diagram was necessary to describe the spatial distribution of the light intensity. Goniometric diagrams use polar coordinates. The light source is located at the center of the sphere, and the positive y axis is pointing upward from the light source. Each intersection between a meridian and a parallel line is defined by two values theta and phi. Theta varies from 0 to 180 degrees with 0 at the south pole. Phi varies from 0 to 360 degrees where 0 is the Greenwich meridian. Light intensities measured at intersections are stored in two-dimensional array, rows of which correspond to meridian and columns to parallel |
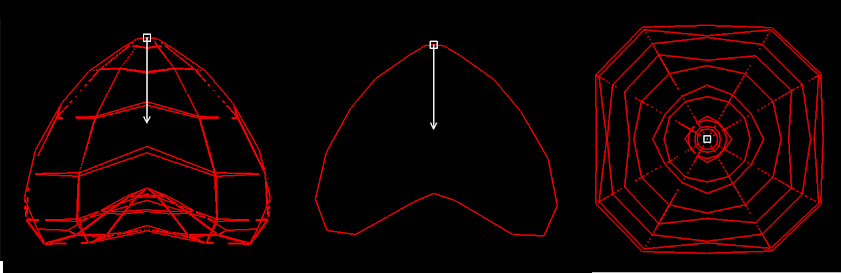
Principal Lights (complete data is available here)
The fixture has two bulbs, but a single goniometric diagram is given
for them. This simplifies computation, but does not reflect well the reality,
especially given that the bulbs have different light color and power. The
goniometric diagram we use is not accurate at a very close distance from
the source, but those inaccuracies don't seem to affect significantly the
lighting measurements on the floor and the total result.
The diagram is asymmetrical because using data
from two different light bulbs. The diagram is built of 37 values for theta
and 72 for phi polar angles.
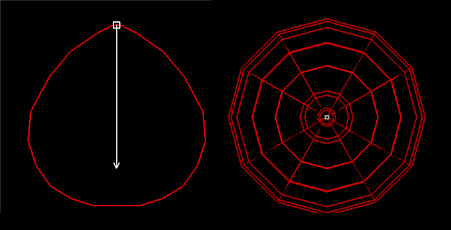
Corridor Lights (complete data is available here)
The diagram is axis symmetrical, which means all the meridians (phi) have identical values.
|
Image gallery | Download sources |