Perception Experiment |
Goal of the psychophysical experiment.
Illumination accuracy was controlled in the measurement experiment.
Rendering generated using measured BRDF materials are closer in global
illumination values to the actual scene than the global illumination generated
using arbitrary values artistically created. Also in the first case the
illumination was under-evaluated as opposed to the second case where
it was over-evaluated, leaving a consequent gap between the two methods.
Simply concluding from the numbers, the scene rendered using BRDF should
be darker and appear more realistic than its artistic counterpart. But
because such a conclusion could not be reached easily by watching rendered
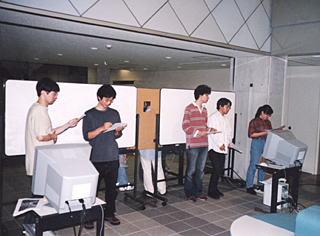
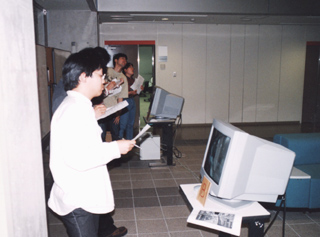
images, we decided to validate results in a full scale cross-media comparison
in which images displayed on the CRT screen were compared directly against
the real-world atrium. Twenty five subjects were questioned, seventeen
of them had taken an undergraduate general computer graphics class; from
this group, twelve had graduate-level knowledge about lighting, global
illumination and advanced rendering techniques. The reminder eight persons
were not trained or had no particular interest in computer graphics.
The subjects were chosen from different nationalities (perception might
be influenced by culture and education), the age of the tested group varied
from 22 to 30 years old. The total experiment involved an extensive questionnaire
of sixteen very precise questions in addition to more general comments
requested from the subjects. A scanned copy of the questionnaire is provided
here
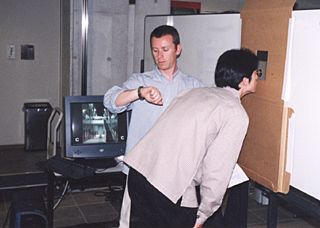
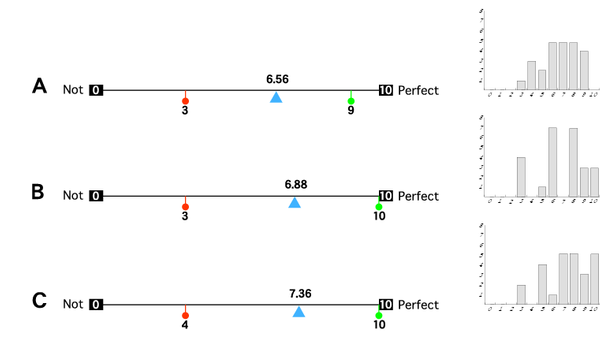
Three images were presented. After watching the atrium through an aperture
during ten seconds, subjects were exposed randomly to one of the pictures
displayed on a computer screen during the same period of time. After having
answered the following questions for the picture viewed, the exercise was
repeated two more times.
The pictures were shown in a random order.
Image A: the rendering using BRDF measured data.
Image B: the rendering using artistic values.
Image C: a picture taken with a digital camera.
For further details about pictures please refer to the gallery
page on this site.
Question 1:
How well did the image approximated reality?
Question 2:
Is the model detailed enough and correct?
Question 3:
How does the tone and contrast compare to reality?
Question 4:
How does the lighting compare to reality?
Analysis of variance:
The analyze of variance was conducted to make sure the results we got
in the experiment can be used as a solid ground before making conclusions
about the images. The following table shows a summary of the variance analysis
performed on the data obtained during the first part of the experiment.
Table 1 analyses two variables: "image", composed of the three different
images A, B and C and a "method" composed of the four questions asked in
part one of the experiment. The table provides values for: the Sum of Squares
SS, the Degree of Freedom df, the Mean Square MS, the value F and the probability
p.
The effect of the method appears in the first row, the second row is
the effect of the image and the third row is the interaction of the two
parameters.
A probability of error less than .05 is considered (p<.05)
-----------------------------------------------------
SOURCE
SS df
MS F
p
===============================================================
method
35.2667 3
11.7556 6.425 <0.05
ms/
131.7333 72
1.8296
image
64.4067 2
32.2033 4.990 <0.05
is/
309.7600 48
6.4533
mi
4.0733 6
0.6789 0.706 0.645
mis/
138.4267 144
0.9613
Since the probability of error is within the considered boundary (<.05)
in both cases, the data obtained through the experiment can be used with
certainty and conclusions will be based on solid proof.
From a statistical point of view, the experiment was a success.
Conclusions:
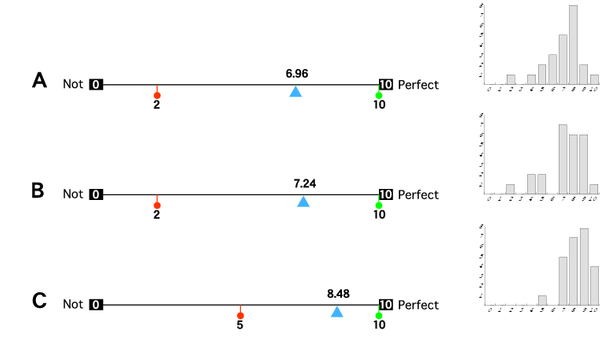
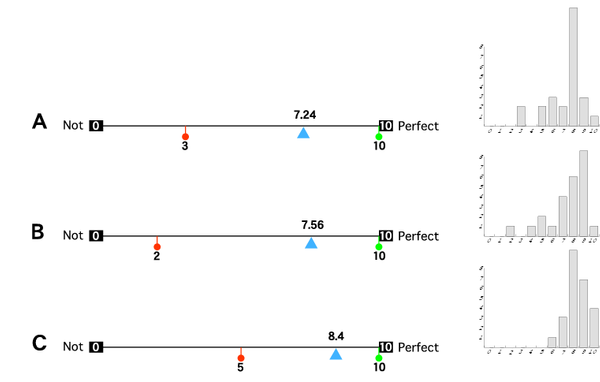
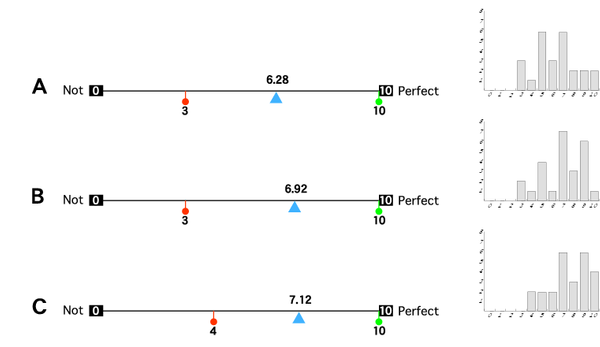
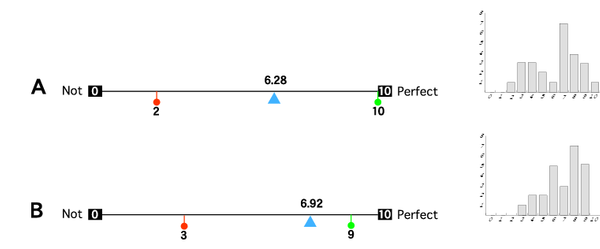
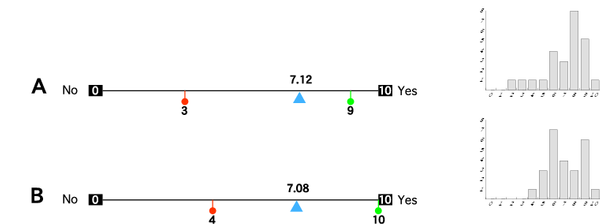
In all cases the photograph got the highest scores with the mean
ranking falling into the range 7.36--8.48. The artistic and BRDF-based
approaches got lower scores falling into the ranges 6.88--7.24 and 6.56-6.96,
respectively. What is remarkable is that the differences in the mean ranking
of photographs and computer images were rather small, below the value of
standard deviation error. The artistic approach which is much easier and
cheaper (no expensive BRDF measurement is required) was slightly higher
ranked than the BRDF-based rendering, which to certain extent explains
why always pragmatic industry chooses tweaking rendering parameters instead
of performing full-fledged physically-based computations. Obviously, such
an approach will fail for rendering the scenes whose appearance is unknown
and cannot be reconstructed even by a skilled artist because of the lack
of reference views.
 |
 |
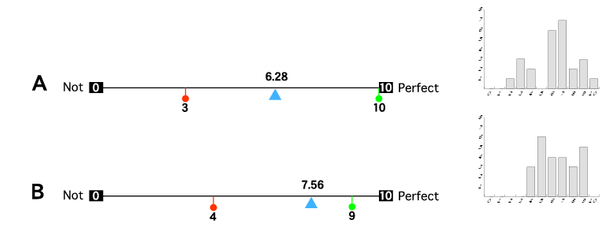
Two sets of four images rendered from different viewpoints in the atrium and using BRDF data versus the artistic method were analyzed without any constraint of time or location. The questionnaire consisted of seven main questions and various comment area.
Group A identify images rendered using BRDF measured data.
Group B identify images rendered using artistic values.
The images presented are shown in the gallery.
1- Lights and lighting conditions:
Question 1:
Is the overall lighting comparable to actual conditions?
Question 2:
How do you feel is the reproduced lighting, too
dark or too bright?
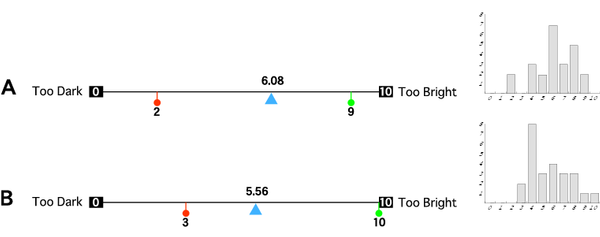
Question 3:
How well do the shadows represent reality?
Hint: watch dark areas under the stairs, in the walkways and behind
the columns; also criticize the position of those areas in the picture.
Question 4:
How well so the highlights represent reality?
Hint: watch metallic and highly reflective parts like glass or ceramics.
Parts may have too much or not enough highlights.
Question 5:
How luminaries compare to reality?
Hint: watch for color of lights and strength of illumination close
to the light sources.
2- Textures and materials:
Question 1:
Are surfaces and materials in accordance to the
atrium?
Hint: criteria such has brightness, contrast, hue, material structure,
surface aspect and reflectance characteristics should be taken into consideration.
Note: further questions were asked concerning which surface appeared to be poorly recreated.
Question 2:
How well do the reflections represent reality?
General questions:
Question 1:
How well does the overall tone of the images compare
to reality?
Question 2:
Would you say that those images are a good approximation
of the atrium?
Analysis of variance:
The variable "question" represents the eight questions asked (the question
about tone accuracy was omitted because using a different rating), "group"
represents the two groups of images presented.
The effect of the question appears in the first row, the second row
is the effect of the group and the third row is the interaction of the
two parameters. The table provide values for: the Sum of Squares SS, the
Degree of Freedom df, the Mean Square MS, the value F and the probability
p.
A probability of error less than .05 is considered (p<.05)
---------------------------------------------------------------
SOURCE
SS df
MS F
p
===============================================================
question 16.9175
7 2.4168
1.170 0.323
qs/
347.1450 168
2.0663
group
5.0625 1
5.0625 0.923 0.346
gs/
131.6250 24
5.4844
qg
9.3175 7
1.3311 0.457 0.864
qgs/
489.4950 168
2.9137
The variance is too different from given parameter, the conclusions we can make from this experiment are not based on solid statistical basis. To reach reliable results we might need to consider a greater number of subjects or test only experts in the field.
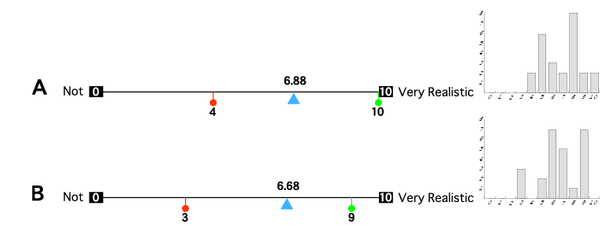
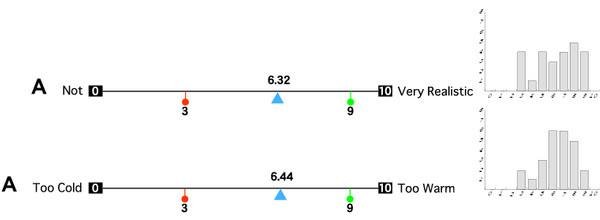
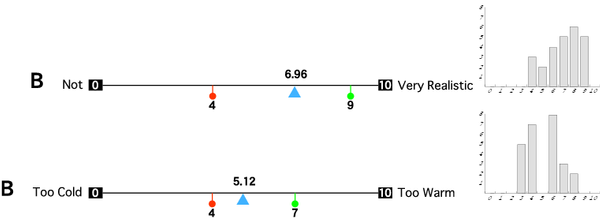
Conclusions:
While in a majority of cases the artistic approach obtained slightly
higher mean ranking scores, the quality of highlights and reflections appearance
was higher ranked for the BRDF-based approach. This suggests that by measuring
the BRDF, better image fidelity can be expected especially for materials
with complex reflectance characteristics. The detailed comments provided
by the subjects revealed that lack of contrast in highlight and shadow
areas is especially annoying. This could be improved by more careful selection
of the TMO. The architectural perfection of the model does not account
for variations in construction and disparities of materials. This becomes
especially well visible near highlights and reflection regions, which are
distorted because of inaccuracies in tiles positioning. Also, in the real-world
scene subjectively stronger specularity can be observed for pink tiled
columns and brown painted panels in the central part of the atrium. This
disagreement in appearance can be explained by inaccuracies in capturing
of rapidly changing specular reflectance during the BRDF measurement.
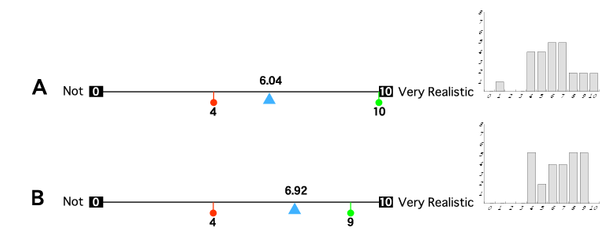
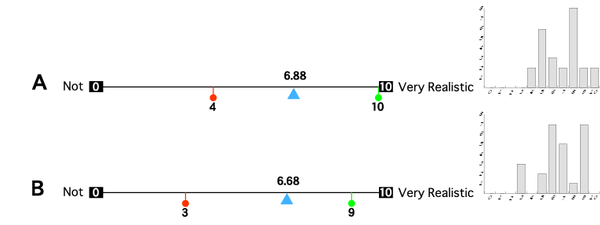
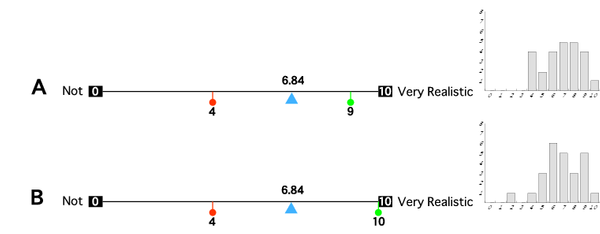
Synthesis:
Question 1:
Which group of images better represents the real
atrium? (which group is more realistic?)
Question 2:
Which group of images do you like the best? (for
example to print a postcard of the atrium)
Statistical analysis:
The numbers indicate a preference towards the artistic images (16 subjects
found them more realistic), but this result should not be taken as an irrefutable
proof of the superiority of the method. A Chi-square analysis of the four
values provided for groupA and groupB gives a result of 0.778 showing that
results might not reflect real variations due to sensitivity of differences.
|
Image gallery | Download sources |